| Corcoran Technical Trading Patterns for November 21 |
| By Clive Corcoran |
Published
11/21/2007
|
Stocks
|
Unrated
|
|
|
|
Corcoran Technical Trading Patterns for November 21
The market produced a modest relief rally yesterday but it was far from the uniform upward trend day that those of a bullish persuasion can derive any comfort from. Traders in the pits especially, but even those watching screens yesterday, would have felt as churned and disoriented as someone who had spent the day on a roller-coaster ride at Disneyland.
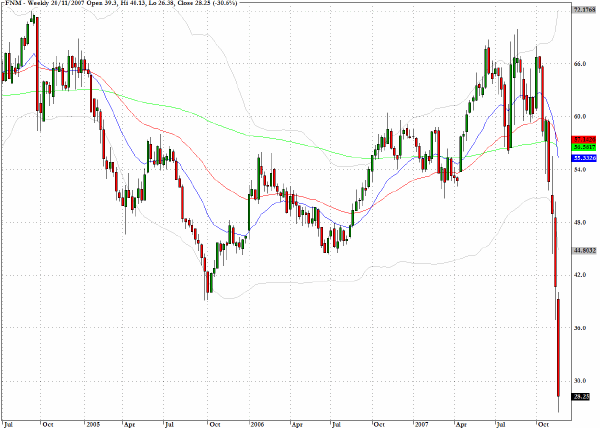
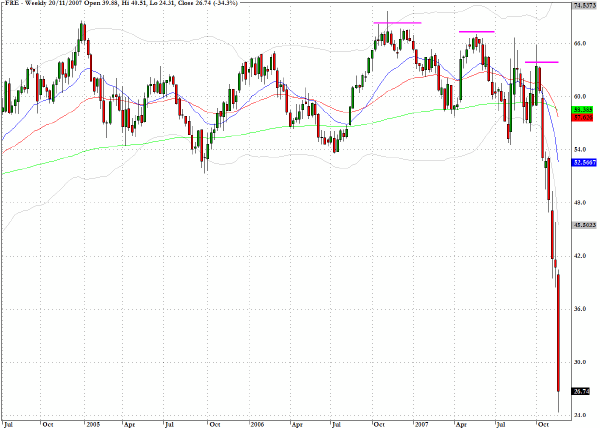
Despite the mild rally in the large caps there were some alarming developments yesterday which as the lawyers like to say, included but were not limited to the 25% plus falls in both Freddie Mac (FRE) and Fannie Mae (FNM). The euro established another new high against the dollar as it closed above 1.48, gold rebounded strongly and crude prices moved up to within a whisker of $100. This is not a market for the faint-hearted and probably favors those traders with short memories as those with a longer view may be paralyzed into inaction as they try to fight off the nagging mantra - Crisis, what crisis?
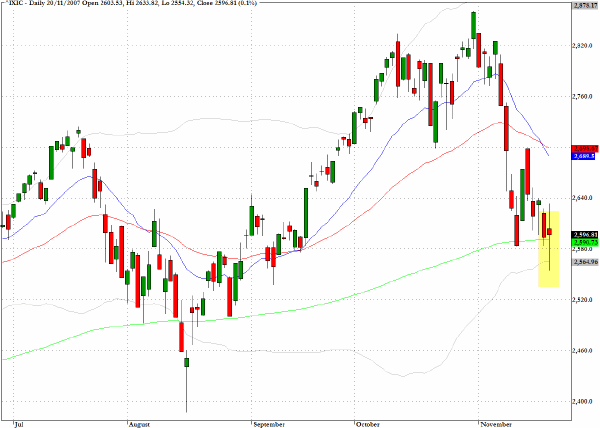
The Nasdaq Composite (^IXIC) spent most of the session exploring lows not seen since early September but then rallied into the close to register a spinning top candlestick which straddles the 200-day EMA. This pattern suggests that we are at a key inflection point but with trading likely to be subdued for the rest of the week the resolution may have to wait until next week. What might surprise today however is the fact that with so many troubling possibilities many traders may want to exit outstanding positions before the holiday. This could tilt the balance again today towards another roller coaster ride which heightens the risk of a nasty derailment.
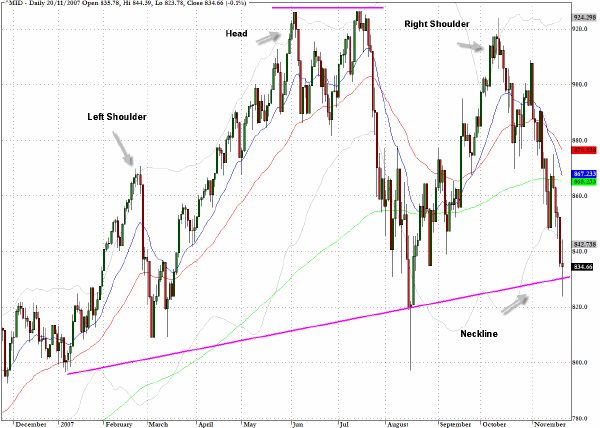
In Monday’s commentary the S&P 400 Midcap index (^MID) was featured and I commented that a decisive breakdown below the 820 level would be a signal of a major trend change. I did not discuss the larger pattern in that commentary but decided to today, after receiving feedback from readers of the newsletter who are pointing to the head and shoulders pattern that is revealed on the daily chart for this index in 2007 (which is also echoed on many other indices).
Construing the chart formation in this fashion also suggests that the neckline runs just above the 820 level. The pattern is not the easiest to classify and I always qualify my judgment about the reliability of such an amorphous formation. For those that do embrace the interpretation, a clear violation of the 820 neckline level would take us down by the distance from the neckline to the top of the head. This represents about 100 points suggesting that a bearish turn of events could take us down quickly to the 720 level on this index. Revealingly this would bring us back to the levels seen in the June/July 2006 correction.
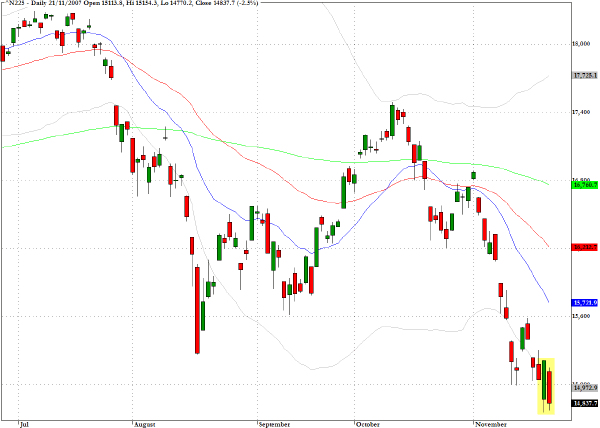
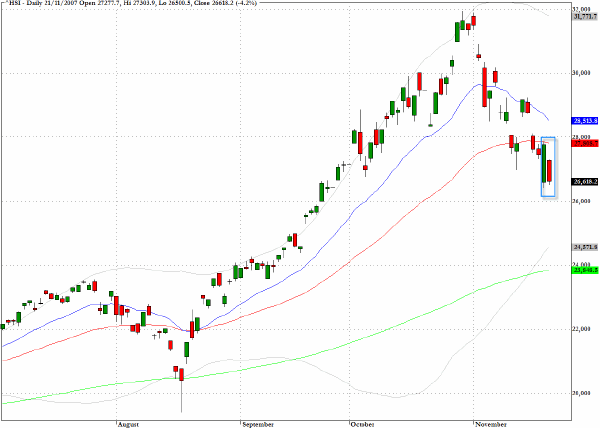
In Asian trading overnight the gains that were made in Tuesday’s trading were almost given back and both the Nikkei 225 (^N225) and the Hang Seng (^HSI) ended up with inside day patterns. The failure to hold on to Tuesday’s rally is a clear negative for both indices and the unwillingness to move outside the range achieved in Tuesday’s session underscores the suspicion that traders in these markets are anxiously watching and waiting for clear directional cues from the US market.
Key weekly trendlines have now been violated on the Nikkei 225 (^N225) and at present the index is hovering just above its 200-week EMA. From a technical perspective a weekly close below this level - approximately 14800 - would trigger further alarm signals.
The Hang Seng index (^HSI) also recorded an inside day, and to play loosely with some metaphors, it may be time to call in the snow ploughs and barriers to try to hold back the avalanche.
TRADE OPPORTUNITIES/SETUPS FOR WEDNESDAY NOVEMBER 21, 2007
The patterns identified below should be considered as indicative of eventual price direction in forthcoming trading sessions. None of these setups should be seen as specifically opportune for the current trading session.
Scanning sector charts there is very little that looks constructive on the long side, and while most charts are looking bearish, I am hesitant to take on additional exposure to current short positions this side of the Thanksgiving break.
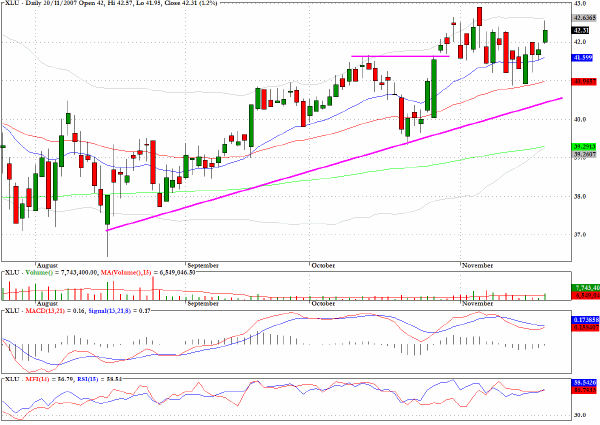
The utilities sector fund, XLU, has a positive price pattern and the underlying money flow looks as though the sector is providing a haven to some footloose capital that is being switched out of many other market sectors.
Not much to say about the next three charts. Fannie Mae (FNM) is in free fall and, as a very widely owned stock by institutions, there have to be managers of many large pension funds, mutual funds and insurance companies that are looking at such price action with outright alarm.
Freddie Mac (FRE) is also very widely held by many long term investors and funds and a chart like the one below is likely to have holders of the stock reaching for the Maalox to aid digestion of tomorrow’s turkey.
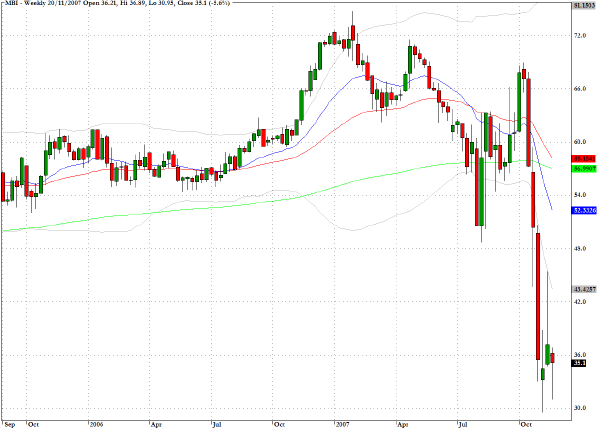
MBIA (MBI) is trying to stablise after its recent plunge but holders of this credit insurer hoping to take comfort that a basing pattern is under way cannot take comfort from the previous two charts.
The preceding three charts are not the foundation that makes one comfortable about current risk management practices and question the reliability of the assurances provided by those that supposedly are providing underwriting guarantees.
I shall not publish again until Monday and would like to wish all of my North American readers a Happy Thanksgiving holiday.
Clive Corcoran is the publisher of TradeWithForm.com, which provides daily analysis and commentary on the US stock market. He specializes in market neutral investing and and is currently working on a book about the benefits of trading with long/short strategies, which is scheduled for publication later this year.
Disclaimer
The purpose of this article is to offer you the chance to review the trading methodology, risk reduction strategies and portfolio construction techniques described at tradewithform.com. There is no guarantee that the trading strategies advocated will be profitable. Moreover, there is a risk that following these strategies will lead to loss of capital. Past results are no guarantee of future results. Trading stocks and CFD's can yield large rewards, but also has large potential risks. Trading with leverage can be especially risky. You should be fully aware of the risks of trading in the capital markets. You are strongly advised not to trade with capital.
|