| Double Bottom for QQQQ? |
| By Mike Paulenoff |
Published
11/21/2007
|
Stocks
|
Unrated
|
|
|
|
Double Bottom for QQQQ?
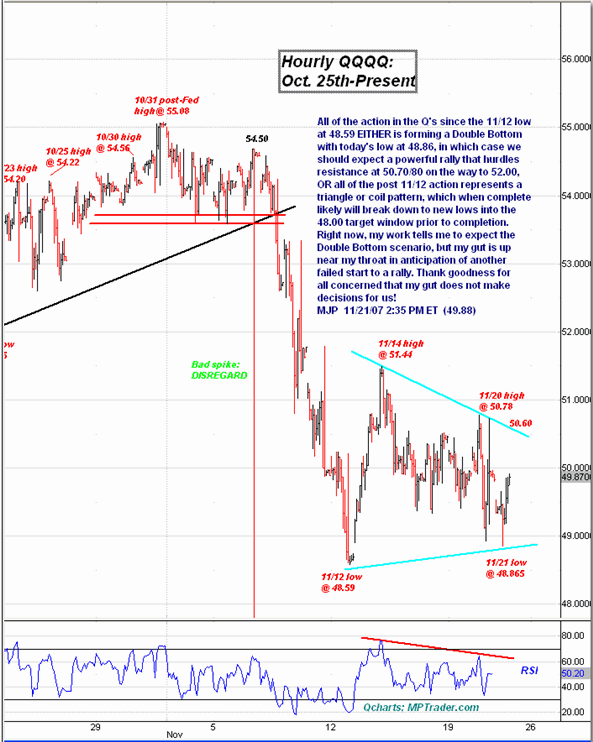
It takes me about 10-12 minutes to prepare one of these chart + text uploads, and lately, I cannot type fast enough to get the thing done before prices are completely out of the range from 12 minutes ago. In this particular case, the Nasdaq 100 Trust Shares (QQQQ) rallied 20 cts in the past 12 minutes. Let's see if the gains can be preserved for more than a few minutes.
As for what I wrote in the chart: All of the action in the Q's since the November 12 low at 48.59 either is forming a double bottom with today's low at 48.66, in which case I should expect a powerful rally that hurdles resistance at 50.70/80 on the way to 52.00, OR all of the post-November 12 action represents a triangle or coil pattern, which when complete likely will break down to new lows into the 48.00 target window prior to completion. Right now, my work tells me to expect the Double Bottom scenario, but my gut is up near my throat in anticipation of another failed start to a rally. Thank goodness for all concerned that my gut does not make decisions for us!


Mike Paulenoff is a 26-year veteran of the financial markets and author of MPTrader.com, a real-time diary of his technical chart analysis and trading alerts on all major markets. For more of Mike Paulenoff, sign up for a free 15-Day trial to his MPTrader Diary by clicking here.
|