| The McMillan Options Strategist Weekly |
| By Lawrence G. McMillan |
Published
11/22/2007
|
Options
|
Unrated
|
|
|
|
The McMillan Options Strategist Weekly
Stock prices continue to behave bearishly. Rallies can't gain footholds, while declines are deeper and more long-lasting than seem possible. As a result, there is an oversold condition in this market one which can spur sharp, but short-lived rallies at any time -- but a true intermediate term buy signal is not at hand, for none of our indicators have turned bullish.
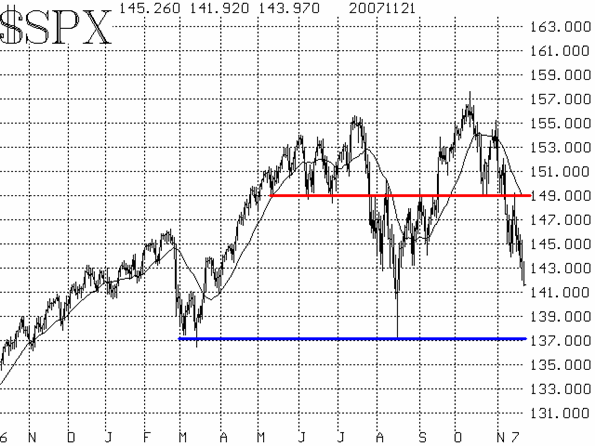
Let's begin with the chart of $SPX itself. It turned bearish when the index fell through what had been support at 1490. That was the last piece of the bearish puzzle, and the market has been under extreme pressure ever since. Any rallies towards 1490 can be sold, as that level now represents resistance. Meanwhile, where is support? It was at 1430-1440, but that level gave way and it seems likely now that the averages will test 1410 (the August closing lows) and perhaps 1370 which is multiple support from both August and March. Should that give way, then a true bear market would be underway.

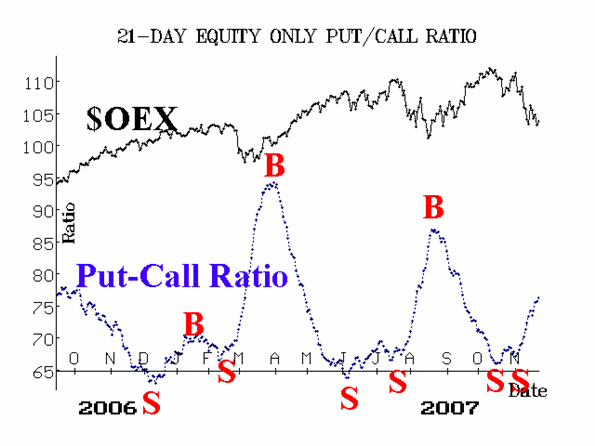
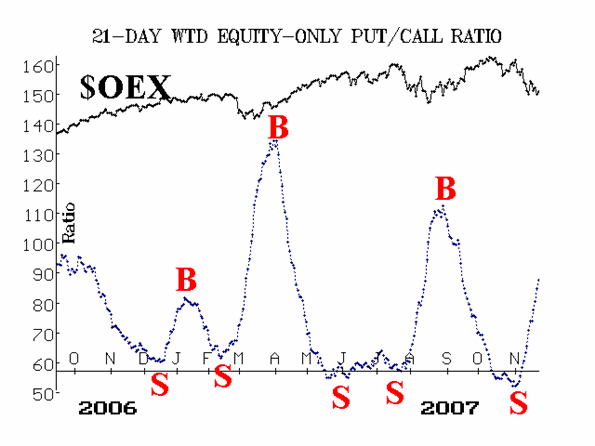
The equity-only put-call ratios (Figures 2 and 3) remain strongly on sell signals as they continue to climb on their charts. They are not "oversold" yet, in our opinion.


Market breadth has been abysmal, but breadth can be considered an indicator that is deeply oversold at the current time.
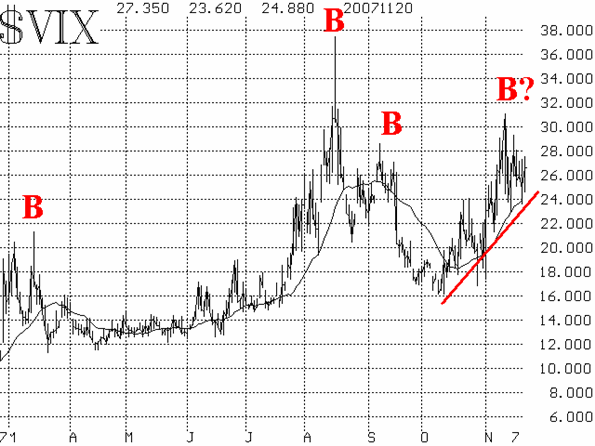
Volatility indices ($VIX and $VXO) have not risen as sharply as you might expect. As a result, at first glance, it appears that there is a spike peak buy signal on the $VIX chart (Figure 4). This is countered, however, by the fact that $VIX continues to be in a rising trend, which is bearish. As long as $VIX remains above its 20-day moving average, we are reluctant to classify it as a bullish.

So none of our major indicators is bullish. In reality, only breadth is deeply oversold. The others have room to run before they reach oversold levels. So, while it may be tempting to try to catch oversold rallies as they occur, don't overstay your welcome, for they are sure to be short-lived until some real buy signals emerge.
Lawrence G. McMillan is the author of two best selling books on options, including Options as a Strategic Investment, recognized as essential resources for any serious option trader's library.
|