| Weekly Outlook in the Stock Market |
| By Price Headley |
Published
11/26/2007
|
Stocks
|
Unrated
|
|
|
|
Weekly Outlook in the Stock Market
NASDAQ Composite
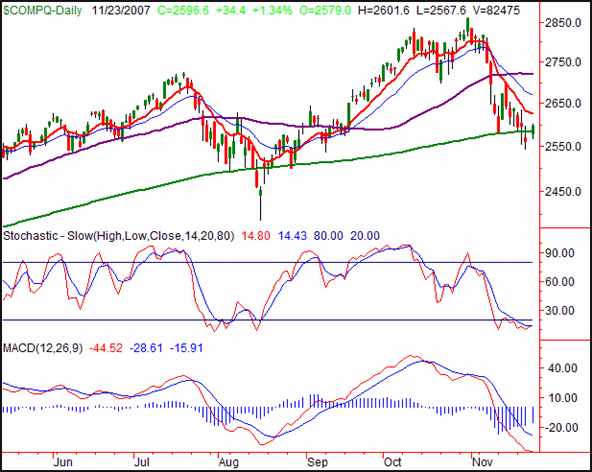
On Friday, the NASDAQ Composite gained 1.34% (+34.4 points) to end the half-session at 2596.6. For the week though, it still closed in the red by 1.54%, or -40.6 points. That may have been enough to go ahead and get a good bottom in place, though we don't want to mistake a true rebound for what may just be the usual Thanksgiving 'drift' higher.
Note the similarities between now and the dip we saw in August. Things looked grim right at the bottom. The 200-day average had just been crossed under pretty decisively. And, the index started to look comfortable with the idea of being stochastically oversold. Then bam, it all changed for the better. So, don't rule anything out; Friday's low volume move back above the 200 day line - tainted by poor volume or not - may have snapped the downtrend.
Just to be able to answer that question on concrete terms, we're waiting for a confirmed stochastic buy signal (which is described in the S&P 500's analysis below).
NASDAQ Composite - Daily

S&P 500
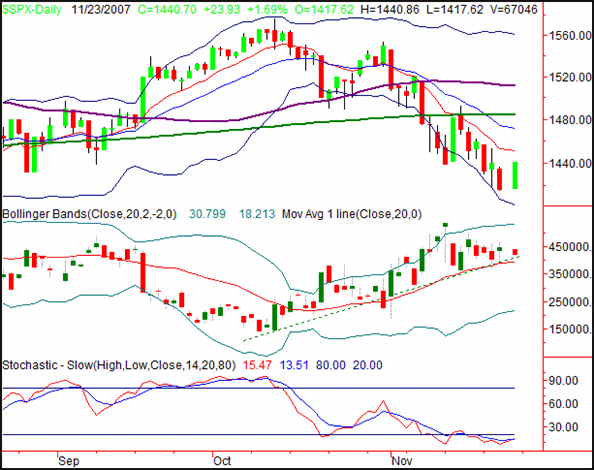
The S&P 500 ended the week at 1440.70, up 23.93 points (+1.69%) for the day. That was still in the hold compared to last Friday's close, by 1.24%, or -18.04 points. Like the NASDAQ, we're seeing hints that it may be a bottom, but we don't have enough conclusive evidence just yet.
As of this week's low of 1415.64, the pullback from the mid-October high of 1576.09 has covered 10.2% of the SPX's value. With the 'normal' correction being a fall of 10%, many could (and are) arguing that now's the time to start thinking about the recovery.
And, we don't entirely disagree. Both of the stochastic lines are now under 20, but more importantly, we're seeing a bullish cross of them under that 20 threshold. For us (at BigTrends), the official stochastic buy signal comes when both the %K and %D lines (the red and blue lines on the stochastic chart) cross back above 20. That's a hint that the oversold condition is actually being corrected. That signal could materialize as early as Monday or Tuesday of the coming week.
For confirmation of such a signal, we'd like to see two things happen.
First, we want to see the S&P 500 move back above its 10-day moving average line, at 1451. It's been about three weeks since we've seen it happen.
Second, we'd like to see the VIX make a lower close under its own 20-day moving average line (the red line on the VIX chart), as well as a close under what has materialized as a support line for the VIX (dashed). Both of those lines are about at the same level, so if we get one we'll probably see the other.
Though we're optimistic, those last little details could go a long way in clinching any renewed bullishness.
S&P 500 - Daily

Dow Jones Industrial Average
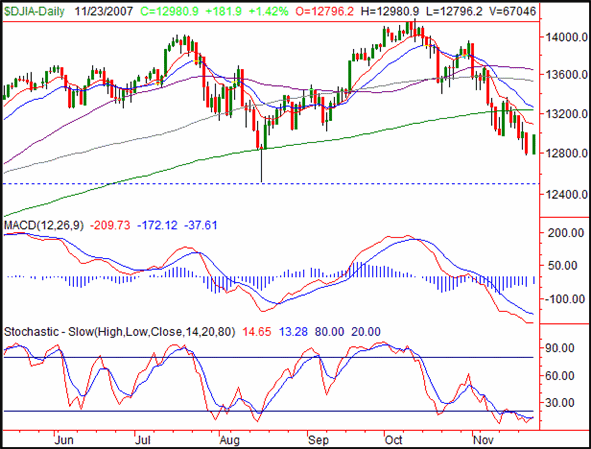
Friday's 1.42% gain (+181.9 points) for the Dow Jones Industrial Average meant a close of 12,980.9. For the shortened week, the Dow saw a 1.49% (-195.9 points) loss. As with the other indices, yes, the selloff has been sufficient enough to really get good and oversold. But - and also like the other indices - we don't quote have a full confirmation that bullish days are immediately ahead.
Not much to add here really; the Dow is under all of its key averages, but way oversold. It's ripe for a turn-around, but that's still a big question mark. We're basically looking for the same kinds of things here that we're watching for the other two indices.
Dow Jones Industrial Average - Daily

Price Headley is the founder and chief analyst of BigTrends.com.
|