| Corcoran Technical Trading Patterns for November 29 |
| By Clive Corcoran |
Published
11/29/2007
|
Stocks
|
Unrated
|
|
|
|
Corcoran Technical Trading Patterns for November 29
Remarks from the vice chairman of the Federal Reserve that lacked the usual opacity of Fedspeak and which pointed quite clearly towards further imminent easing, highlighted the predicament for the bears that I touched on yesterday. Despite bringing us all to the abyss before Thanksgiving and causing shudders as we all looked over it, their inability to take the indices down below key support levels, combined with knee jerk optimism that arises from the promise of further interest rate cuts, sowed the seeds for a major short covering panic which propelled the indices upwards in a strong trend day.
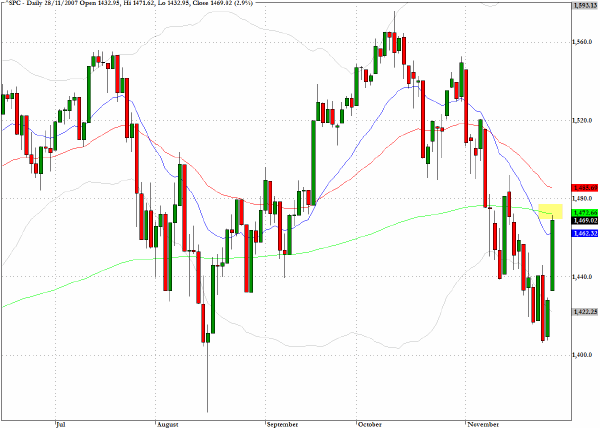
The S&P 500 (^SPC) rocketed ahead by almost three percent and has now completed the journey from mid-August low levels back to the 200-day EMA. While breadth was very strongly bullish the volume was not as impressive as one would have expected from such a powerful surge. The SPY proxy actually registered volume that was below the fifteen day moving average.
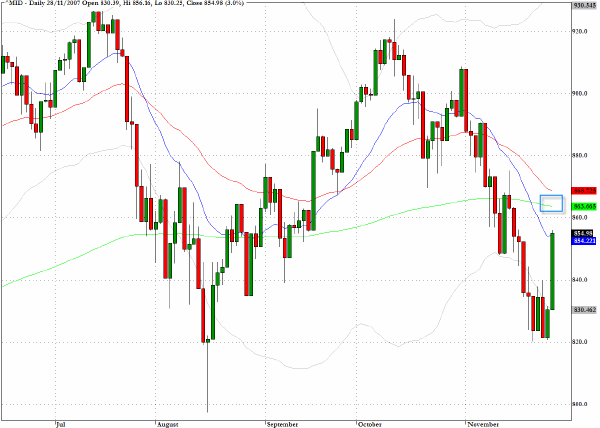
In line with most of the indices the S&P 400 Midcap Index (^MID) experienced a strong trend day which took the index way above the 820 test zone. The next target would appear to be the 865 area which is where the 50- and 200-day EMA’s are converging.
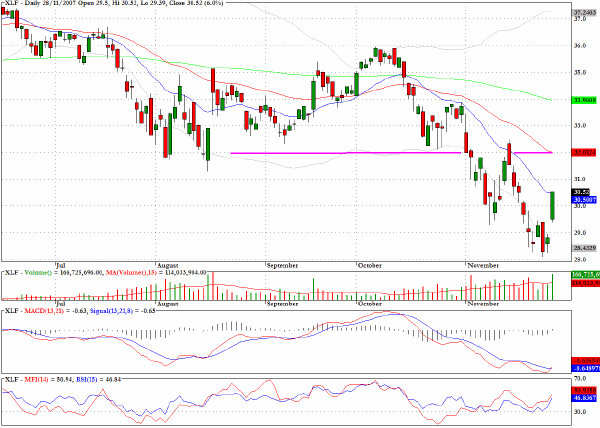
As in mid-August, it was the banks, investment banks and other financials that represented the sector where short sellers had become most entrenched and complacent. XLF should be able to make the move up to the $32 level before strong overhead resistance will begin to weigh on the sector again.
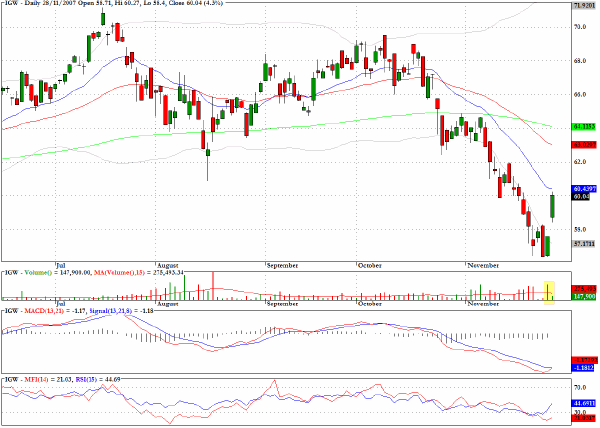
The semiconductor sector gapped up and recorded a four percent gain but as the volume chart reveals this was not the kind of dramatic turnaround that suggests that asset managers were bargain hunting en masse.
TRADE OPPORTUNITIES/SETUPS FOR THURSDAY NOVEMBER 29, 2007
The patterns identified below should be considered as indicative of eventual price direction in forthcoming trading sessions. None of these setups should be seen as specifically opportune for the current trading session.
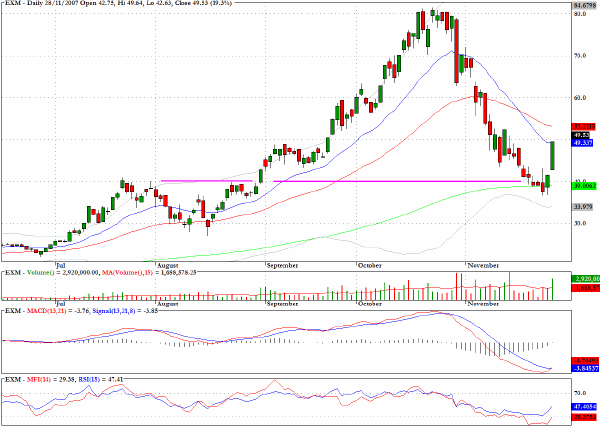
After losing more than fifty percent in six weeks Excel Maritime (EXM) mounted an impressive rally from a fairly obvious support level. The shipping stocks which often move in harmony with the materials sector and many of the Chinese companies were boosted by the promise of fed easing and renewed optimism that the dynamism of the Asian economies will soften the blow of a US slowdown, which, so the argument goes, may itself be less severe as the Fed comes to the rescue.
This change in the mood music could help to keep the broad equity market rally going for a while at least up to the next FOMC meeting in mid December. Having said that there is the ever present possibility that more financial skeletons may drop out of the closet at any moment.
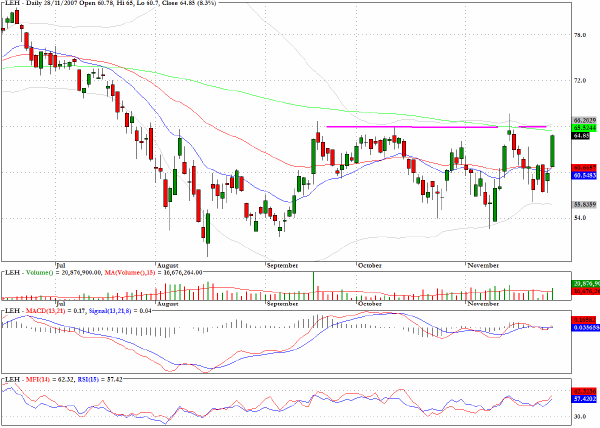
Lehman Brothers (LEH) moved up by more than eight percent but as the chart reveals there is a strong layer of resistance to overcome at the $65/66 level.
Clive Corcoran is the publisher of TradeWithForm.com, which provides daily analysis and commentary on the US stock market. He specializes in market neutral investing and and is currently working on a book about the benefits of trading with long/short strategies, which is scheduled for publication later this year.
Disclaimer
The purpose of this article is to offer you the chance to review the trading methodology, risk reduction strategies and portfolio construction techniques described at tradewithform.com. There is no guarantee that the trading strategies advocated will be profitable. Moreover, there is a risk that following these strategies will lead to loss of capital. Past results are no guarantee of future results. Trading stocks and CFD's can yield large rewards, but also has large potential risks. Trading with leverage can be especially risky. You should be fully aware of the risks of trading in the capital markets. You are strongly advised not to trade with capital.
|