| Weekly Outlook in the Stock Market |
| By Price Headley |
Published
12/2/2007
|
Stocks
|
Unrated
|
|
|
|
Weekly Outlook in the Stock Market
NASDAQ Composite
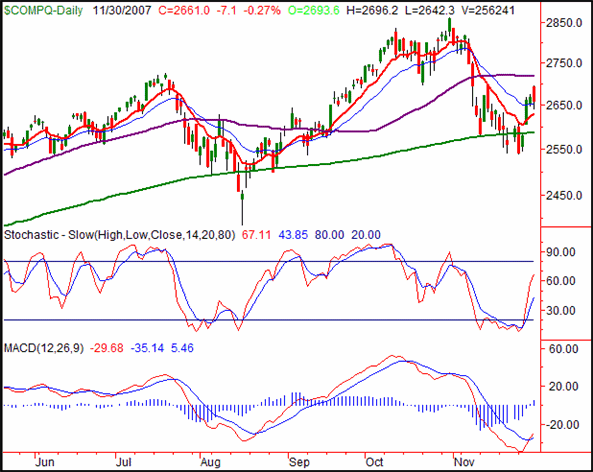
Friday's 7.1 point loss (-0.27%) for the NASDAQ Composite left it at 2661.0. For the week though, the index still gained 64.4 points (+2.48%). As for what's next, despite the fact that we were due for a bounce, the one we got on Wednesday was about as un-tempered as you could ever expect. The big gap from that day still looms.
In one fell swoop on Wednesday the NASDAQ hopped back above the 10- and 20-day moving averages, leaving a gap between 2585.9 and 2606.9. That prompted two of the key buy signals we habitually watch for - stochastics, and MACD. The problem was the gap, a problem that become evident today when the market looked back and realized it had gotten a little ahead of itself.
Normally we're of the mindset that gaps usually get filled. But, 'normally' is a big qualifier. Just for the record, the NASDAQ hasn't filled its gap at 2460.5 yet - the one from mid-August, the first day of the rebound. So, it doesn't absolutely have to happen. In that regard, this move higher is indeed bullish.
That said, we're not exactly encouraging anyone to leave 'buy at the market' orders for Monday morning. Let's see how things take shape at the time.
NASDAQ Composite - Daily

S&P 500
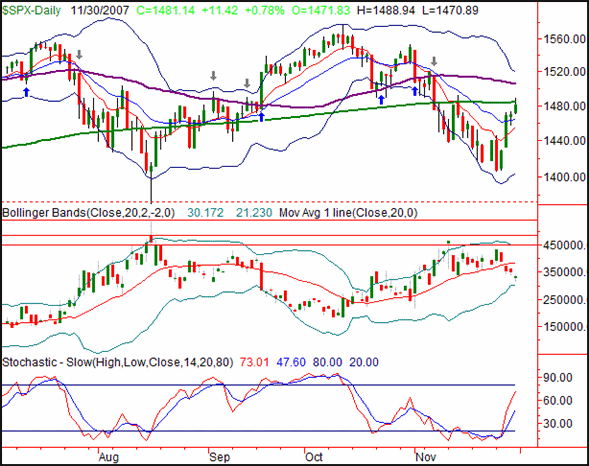
The S&P 500 rallied by 11.42 points (+0.78%) on Friday, closing out at 1481.14. That was 40.44 points (+2.81%) for the week, but left the large cap index back at a trouble spot. Monday/Tuesday should prove pivotal.
While theoretically every index has a shot at moving higher, the S&P 500 looks the most challenged. The most blatant red flag we see here is Friday's run in with the 200-day moving average (green). The index retreated as soon as it was touched. While you can expect a little hesitance, it's not the first time we've seen the SPX have trouble here. Just look back to mid-November - the SPX continued to sink after briefly trading above it on the 14. To see it happen again? Suspicious.
The other fast-approaching problem is the VIX; it's near the lower band line (though not quite there yet). That's a likely bounce point for the VIX, and therefore a likely pullback point for the market.
So, we remain less than enthusiastic about the market's upside here, or at least we're in 'wait and see' mode.
Though we like to use the 200-day line in general, we don't mean to imply it's been spot-on as a support/resistance line. Go back to August and September - the index waffled all around it for days on end.
In the current environment, we see much more value in the 50-day moving average line (purple). It did play support in October for a while, but once it broke, it truly was a breakdown for stocks. And back in September, it did hold the index down for a while, but once it was breached, the market really was rolling. (See all the arrows for where the SPX found or broke support and resistance at the 50-day average.)
Based on this 'good' history, we're going to use the 50-day average - at 1505 - as our bullish indicator. That's still significantly above where we are now, but prudent all the same.
As far as downside goes, let's re-initiate the 10-day average is our support. It's at 1455.
S&P 500 - Daily

Dow Jones Industrial Average
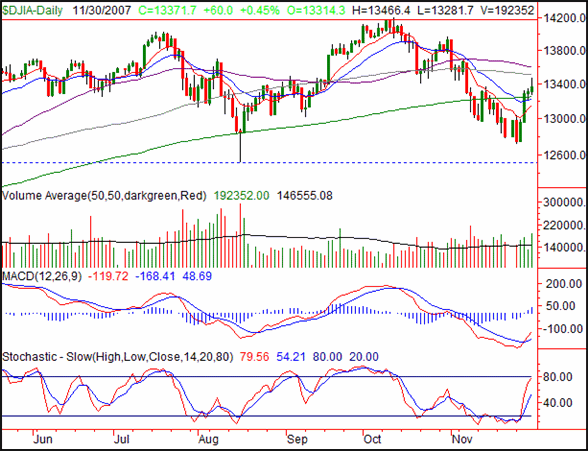
The 60.0 point gain (+0.45%) for the Dow Jones Industrial Average in Friday translated into a close of 13,317.7. On a weekly basis, we saw the index end the week 3.01% better (+390.8 points) than the previous Friday's close.
The Dow had just enough momentum to pop back above the 10-, 20-, and 200-day averages on Wednesday, but has been very lackluster since then. For a while things looked healthy on Friday, but the blue-chip index gave up a good-sized piece of the intra-day gain.
Yes we got a MACD buy signal. And yes we got a stochastic sell signal. And, maybe they're both correct. However, we also want to note that the Dow is almost stochastically overbought again, a testament to the idea that the bounce was too much, too soon.
As with the S&P 500, we'd prefer to see a cross back above the 50-day line at 13,600 as a safe buy signal. And also like the S&P 500, the Dow is likely to have a ton of support from the moving averages it juts crossed. The lowest of those is the 10-day line (red) at 13,156.
Dow Jones Industrial Average - Daily

Price Headley is the founder and chief analyst of BigTrends.com.
|