| Corcoran Technical Trading Patterns for December 3 |
| By Clive Corcoran |
Published
12/3/2007
|
Stocks
|
Unrated
|
|
|
|
Corcoran Technical Trading Patterns for December 3
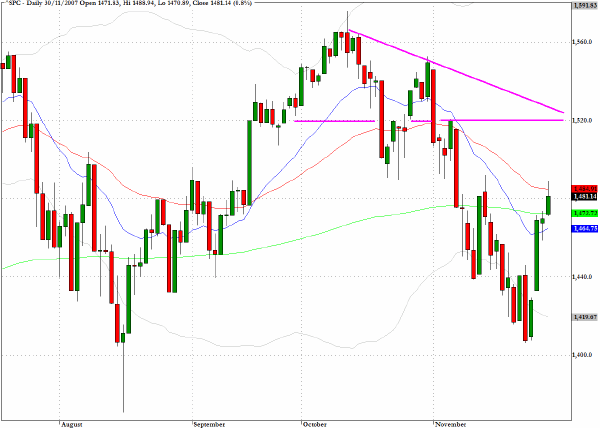
A key level on the S&P 500 to be watching this week lies about forty points above the index’s close from last Friday. Bullish traders will want to challenge resistance near to 1520 which initially requires a break above the 50-day EMA hurdle and then burrowing through general chart congestion and a descending trend line through the lows since the October 9 high.
Of the six hundred most liquid equities in the US market that I scan and analyze in depth on a daily basis, almost fifty percent of them finished last Friday more than five percent higher than where they finished the previous Friday. Only ten of the six hundred concluded with a five percent loss for the week. It was an impressive turnaround that was triggered by a massive short covering of the banks and other financials but there was also evidence of new institutional buying as many managers scrambled not to get left behind in what has so far been a difficult year for long only funds. The realization appears to be dawning for many asset managers that the extreme pessimism reflected in the large short bias since mid October has, at least until the next FOMC meeting, run its course.
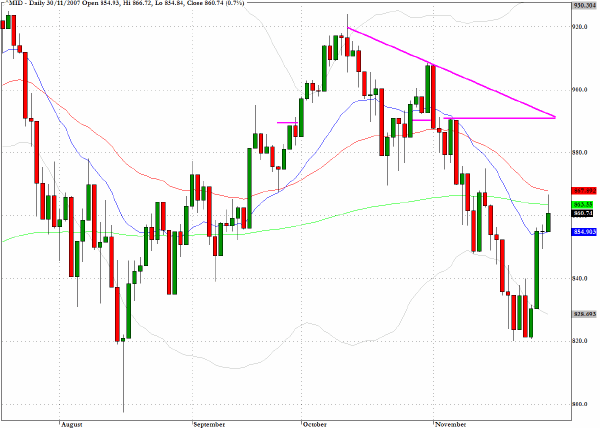
The S&P 400 Midcap Index (^MID) faces a similar challenge to its larger cap cousin and if the bulls are to sustain the dramatic turnaround the 885-90 area will need to be breached in coming sessions.
Can the bulls really take control and push us to new multi-year highs before the end of this year? Just to be asking such a question seems quite remarkable but I would suggest that if we could see a successful recovery above the 800 area on the Russell 2000 index (^RUT) - a level which has proven to be formidable resistance for the small caps since mid October - then positive seasonal factors and ongoing accommodative Fedspeak could lead to a complete capitulation by short sellers as the year winds down. If such a scenario plays out there is an increased capacity for severe dissonance and disappointment in early 2008.
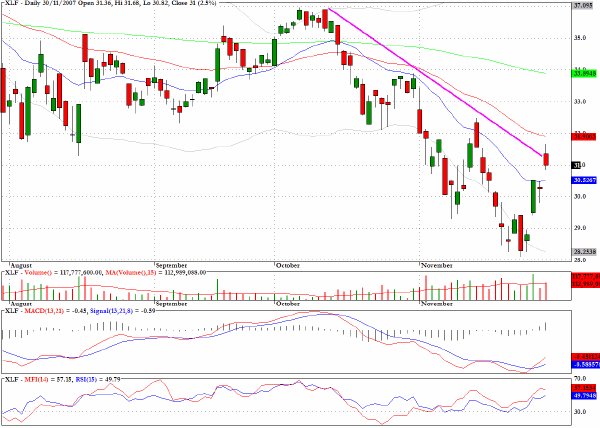
XLF, the sector fund for the financial services made good progress last week from an oversold condition. The fund broke above the 20-day EMA but now has to confront the trendline through the recent highs which closely aligns itself with the 50-day EMA.
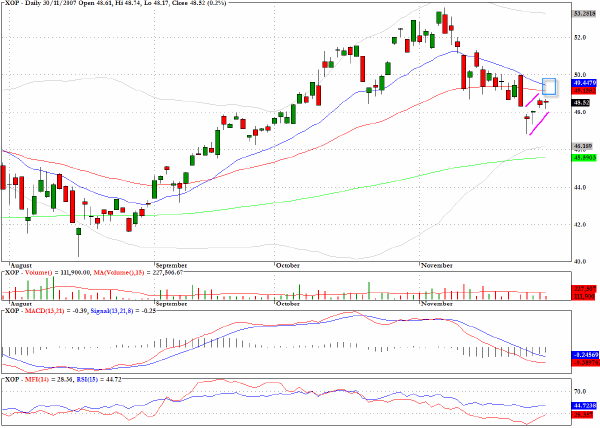
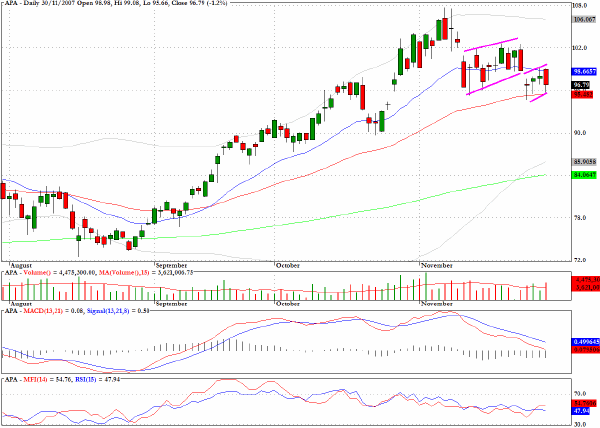
The sector fund for oil and gas exploration (XOP) shows a tiered bearish flag formation and there is clear overhead resistance where both of the short term moving averages intersect.
TRADE OPPORTUNITIES/SETUPS FOR MONDAY DECEMBER 3, 2007
The patterns identified below should be considered as indicative of eventual price direction in forthcoming trading sessions. None of these setups should be seen as specifically opportune for the current trading session.
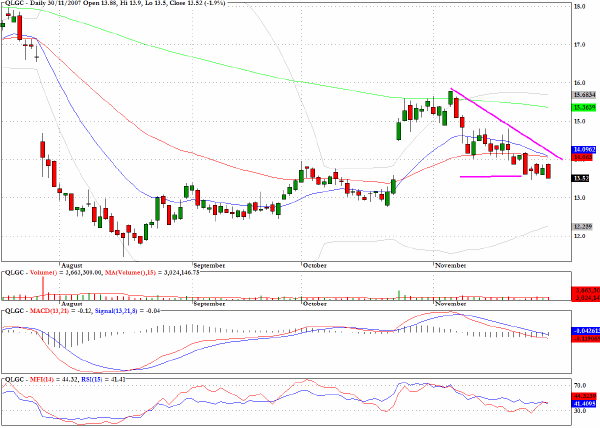
I would be looking for a good entry point on the short side for QLogic (QLGC), which closed last week below the 20- and 50-day EMA’s and where the pattern since early November resembles a bearish descending wedge formation.
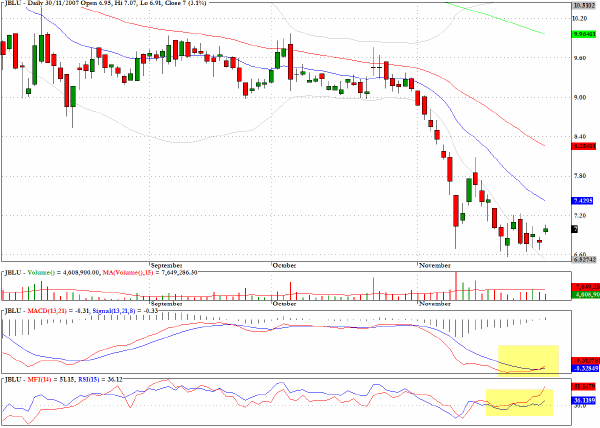
On the long side I shall be watching some of the airline stocks that appear to be emerging from basing patterns. JetBlue Airways (JBLU) and Southwest Airlines (LUV) both have constructive looking chart patterns suggesting that they want to move higher this week.
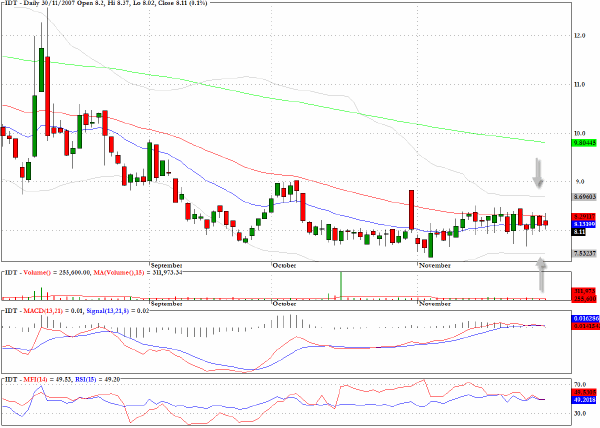
IDT Corporation (IDT) has entered a very constricted range in which just one dollar separates the upper and lower volatility (Bollinger) bands. There is some suggestion from the MACD and money flow charts that a break upwards could be quite explosive.
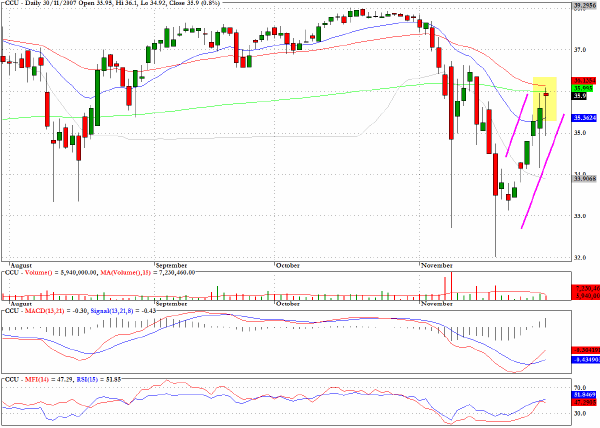
Clear Channel (CCU) saw two selling surges in early and mid November and since then has pulled back to meet resistance at the $36 level which is where the 200- and 50-day EMA’s have converged. The long tailed hanging man candlestick registered last Friday suggests that at least a temporary correction could be imminent.
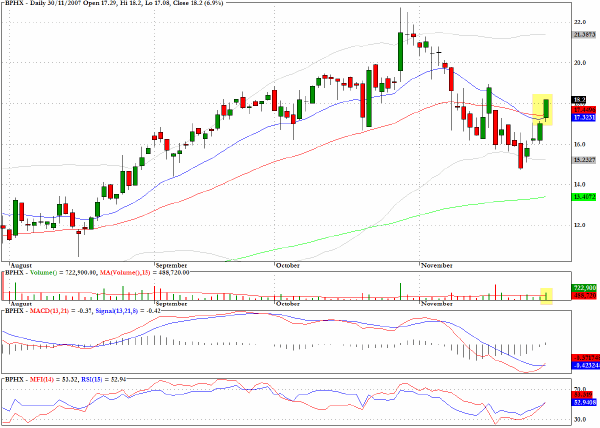
Blue Phoenix (BPHX) rose above key moving averages on heavy volume last week and now appears to be headed back towards recent highs above $21.
The chart for Apache Corporation (APA) echoes the formation that was seen on the XOP sector fund that was reviewed above.
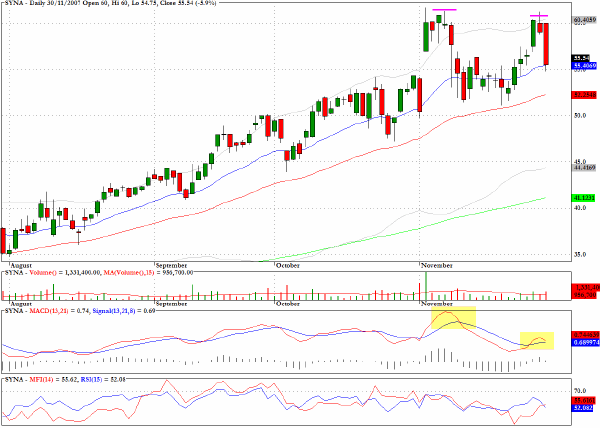
Synaptics (SYNA) has had some negative divergences on its chart for some time but the most recent double top at the $60 level coincides with a notably lower high on the MACD chart segment.
Clive Corcoran is the publisher of TradeWithForm.com, which provides daily analysis and commentary on the US stock market. He specializes in market neutral investing and and is currently working on a book about the benefits of trading with long/short strategies, which is scheduled for publication later this year.
Disclaimer
The purpose of this article is to offer you the chance to review the trading methodology, risk reduction strategies and portfolio construction techniques described at tradewithform.com. There is no guarantee that the trading strategies advocated will be profitable. Moreover, there is a risk that following these strategies will lead to loss of capital. Past results are no guarantee of future results. Trading stocks and CFD's can yield large rewards, but also has large potential risks. Trading with leverage can be especially risky. You should be fully aware of the risks of trading in the capital markets. You are strongly advised not to trade with capital.
|