| Corcoran Technical Trading Patterns for December 5 |
| By Clive Corcoran |
Published
12/5/2007
|
Stocks
|
Unrated
|
|
|
|
Corcoran Technical Trading Patterns for December 5
It was the large Nasdaq stocks that provided leadership during October’s broad market advance and then as the money market woes spooked traders during November, and especially in the lead up to Thanksgiving, many of these large stocks went into a tailspin as long only fund managers began to jettison the more stellar performers like Apple, Google and even Microsoft.
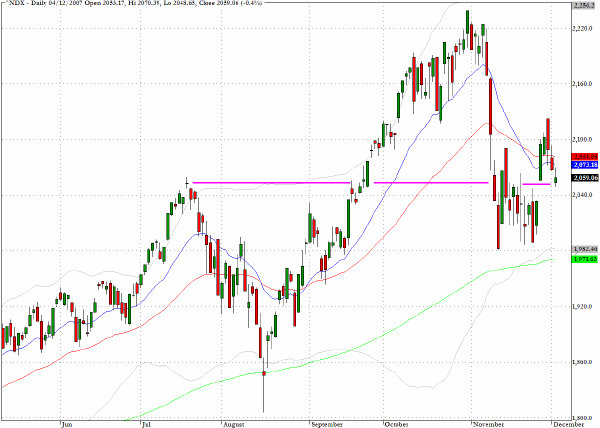
The equities rally last week, which was mainly focused on the financials, did not really provide much of a fillip to the tech stocks and the 100 largest components of the Nasdaq have now retreated to a pivot level.
The chart for the Nasdaq 100 (^NDX) shows that the 2050-2070 area represents a key chart level as it marked the swing high in mid-July, the breakout level from late September and also coincides with the 50-day EMA. If we are to see a year end rally it would be surprising for it to happen without us seeing some renewed vigor from many of the constituents of this index.
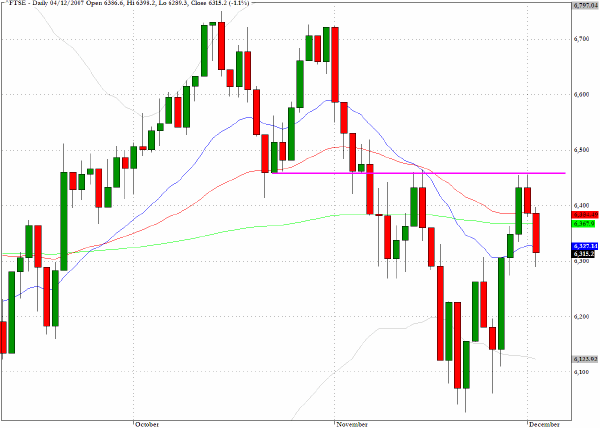
One of the more interesting indices at present and one that I shall focus on in my guest analyst slot today on CNBC’s European Closing Bell is the UK’s FTSE 100. The index retreated in yesterday’s session by a little more than one percent and closed below all three moving averages. However as this commentary is being written the index has advanced by more than 1.4% and has now regained a foothold above 6400. The index is out-performing both the CAC40 and the German DAX in today’s session as there is a growing sense that the Bank Of England could be preparing for an easing when it meets tomorrow.
The chart level that I have drawn represents the 6457 level which, as is apparent, passes through several recent intraday highs where resistance has been encountered. This level sits exactly at the 62% retracement of the swing high in October and the swing low in late November. Penetrating above this level will be a real test for the bulls even if the B oF E obliges with a cut in the repo rate.
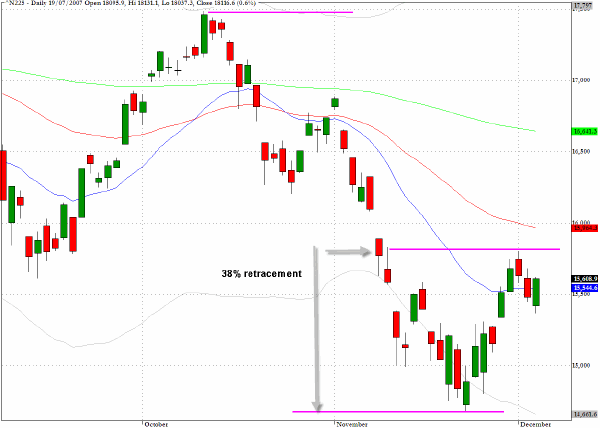
The Nikkei 225 (^N225) has made a valiant recovery effort since its encounter with the abyss at the end of November. The 38% retracement from the recent swing high and low sits at 15740 which also marked the intraday high for trading in Monday’s session.
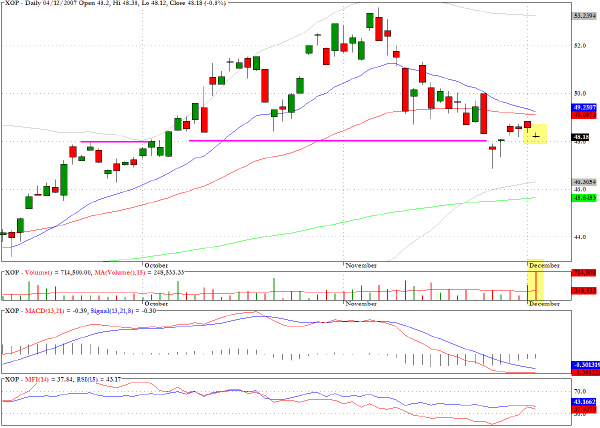
In Monday’s commentary, reference was made to the technically weak pattern in the sector fund XOP which is populated with companies in oil and gas exploration. The closing level yesterday is at a pivot point on the chart and also within the context of what appears to be a bearish flag formation.
However the very large volume recorded in yesterday’s session without a significant move out of the flag would cause me to be cautious at this juncture, as this is not in accordance with the usual technical characteristics of the flag pattern.
TRADE OPPORTUNITIES/SETUPS FOR WEDNESDAY DECEMBER 5, 2007
The patterns identified below should be considered as indicative of eventual price direction in forthcoming trading sessions. None of these setups should be seen as specifically opportune for the current trading session.
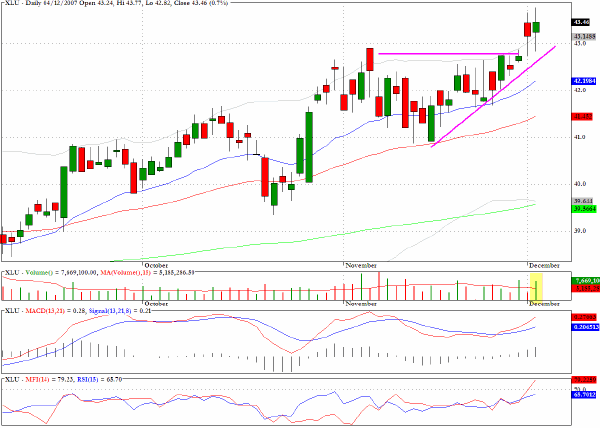
The Dow Jones Utilities index (^DJU) established another historic high yesterday and here are my comments from two weeks ago regarding the sector.
"The utilities sector fund, XLU, has a positive price pattern and the underlying money flow looks as though the sector is providing a haven to some footloose capital that is being switched out of many other market sectors."
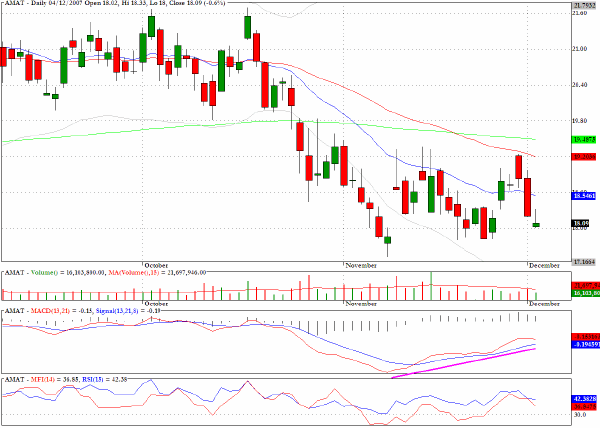
Applied Materials (AMAT) has a rather constructive MACD chart where there is a positive slope which diverges from the recent price action.
Clive Corcoran is the publisher of TradeWithForm.com, which provides daily analysis and commentary on the US stock market. He specializes in market neutral investing and and is currently working on a book about the benefits of trading with long/short strategies, which is scheduled for publication later this year.
Disclaimer
The purpose of this article is to offer you the chance to review the trading methodology, risk reduction strategies and portfolio construction techniques described at tradewithform.com. There is no guarantee that the trading strategies advocated will be profitable. Moreover, there is a risk that following these strategies will lead to loss of capital. Past results are no guarantee of future results. Trading stocks and CFD's can yield large rewards, but also has large potential risks. Trading with leverage can be especially risky. You should be fully aware of the risks of trading in the capital markets. You are strongly advised not to trade with capital.
|