| A Mid-Week Look at the Market |
| By Price Headley |
Published
12/6/2007
|
Stocks
|
Unrated
|
|
|
|
A Mid-Week Look at the Market
NASDAQ Composite
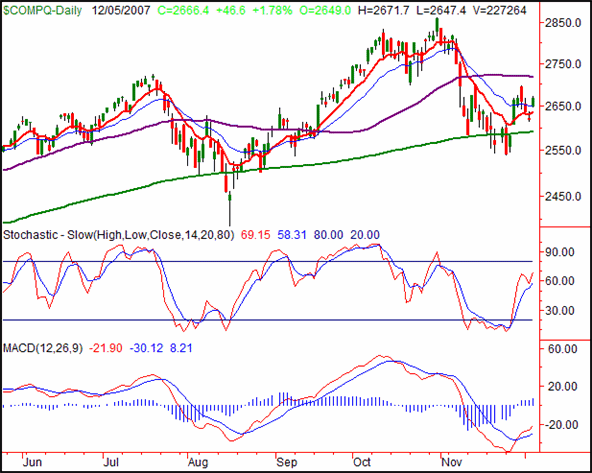
The NASDAQ Composite gained 1.78% on Wednesday (+46.6 points) to close out at 2666.4. For the week, it's now back in positive territory by 0.2% (5.4 points). So is all clear for the bulls? Not by a long shot. We don't trust Wednesday's strength any more than we trusted last Wednesday's - nor any more than we trust Monday's big dip.
As if one gap wasn't enough to worry about, now we're contending with two. The first one is last Wednesday's, between 2586 and 2607. The other one is yesterday's, between 2636 and 2647.4. Both could present problems, though we also want to point out that the gap from August 17 has yet to be filled, and may never be.
Though we'll take a slightly-pessimistic slant with the other two indices, we want to use the NASDAQ's chart to point out the similarities between now and August: a slight dip under the 200-day line, than a pretty strong rebound. Positionally (not even sure that's a word) the key moving average lines are now where they were then. We think a move above the 50-day average at 2718 would really clinch that possibility.
NASDAQ Composite - Daily

S&P 500
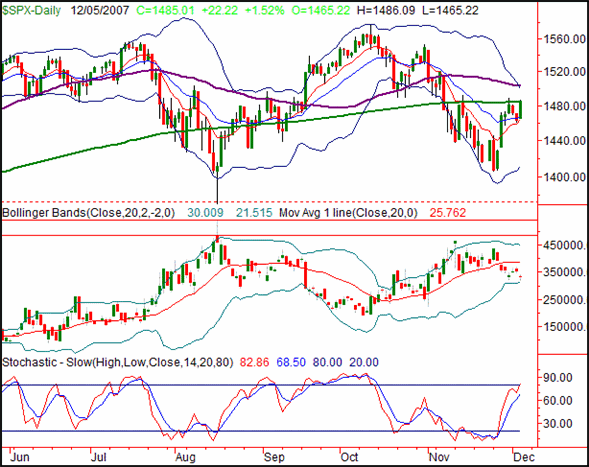
On Wednesday, the S&P 500 bounced by 22.22 points, or 1.52%. That move to 1485.01 leaves the index up by 0.26%, or 3.87 points, for the week so far. Like the NASDAQ though, we're still not convinced there's a whole lot of substance to - or much life left in - this surge. The theory's a hair away from being disproved, though.
Wednesday was the second day in the last four that the S&P 500 faltered when trying to get back above the 200-day moving average line (green). That's no small hint. And even if the 200-day line breaks, the 50-day average and the upper Bollinger band (20 day, 2 SDs) are teaming up at 1500, ready to block any breakout move. In other words, the SPX has its work cut out for it if there's going to be a December rally.
The problem (as we've discussed at length for our service subscribers) is the VIX. The VIX appears to be closer to finding support than the market finding more inspiration. The VIX will have to gently force its lower band lower if the rally is to have any chance at surviving.
Support is at 1465. And, it's the only support line there is until you get to 1412.
S&P 500 - Daily

Dow Jones Industrial Average
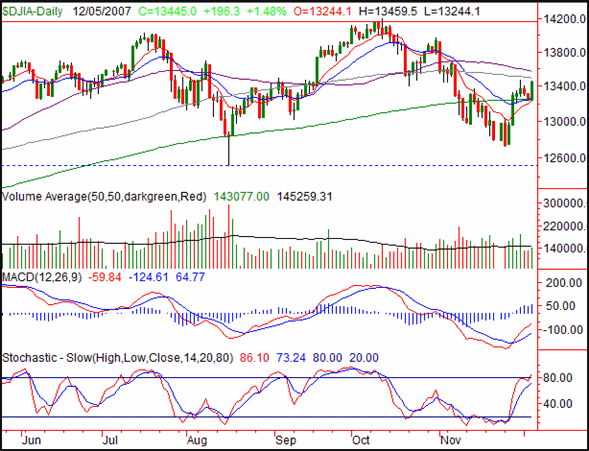
The Dow Jones Industrial Average's close at 13,445.0 on Wednesday was the result of a 196.3 point (+1.48%) gain. That was the weakest performance of the day, but week-to-date the Dow is still leading the pack by being 0.55% higher (+73.3 points) ahead of last week's close.
As of Wednesday, the Dow is finding support at the 10, 20, and 200 day moving average lines. That's great, though it still hasn't pressured the 100 or 50 day averages. In other words, we're not overly impressed yet. Those potential ceilings lie at 13,572 and 13,495, respectively. If the Dow can cross those, then we'll start believing.
The challenge to the so-far-undone-feat is the fact that we're close to being overbought (stochastically) already. And it's not like volume has been inspiring as we've made our way higher after hitting a low of 12,724 in late November.
Dow Jones Industrial Average - Daily

Price Headley is the founder and chief analyst of BigTrends.com.
|