| The McMillan Options Strategist Weekly |
| By Lawrence G. McMillan |
Published
12/7/2007
|
Options
|
Unrated
|
|
|
|
The McMillan Options Strategist Weekly
The broad market has clearly broken out on the upside, with confirming bullish technical indicators chiming in on the "buy side"as well. I'm not certain that I understand the logic of the market rally, given the fundamental news, but, really, what's logic got to do with it? Better to merely analyze the data and leave the opinions aside.
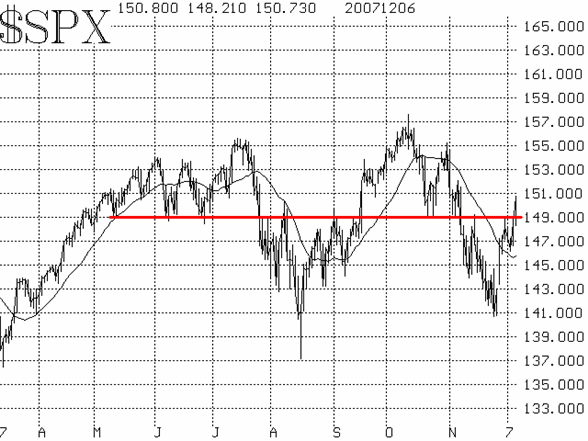
While the $SPX chart isn't exactly a bullish one (it looks morelike a large trading range), overcoming the 1490 resistance level was significant. So now that area once again should act as support.Classically, this short-term rally should last a while longer, and then there should be a pullback towards that 1490 support, before higher prices ensue.

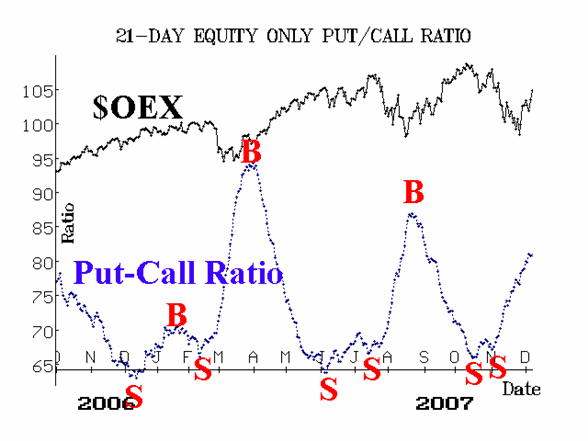
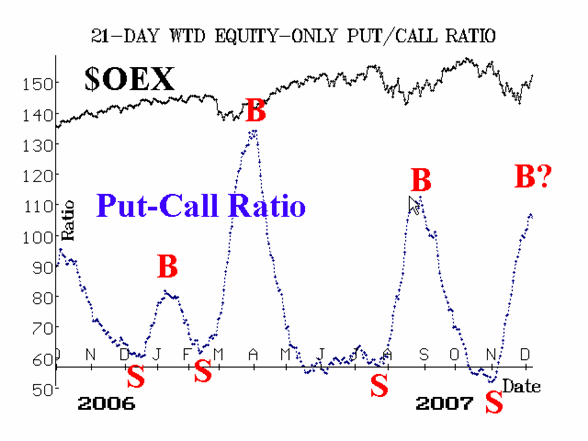
The equity-only put-call ratios have continued to rise on their charts. They haven't visually rolled over to buy signals yet, but they can be considered "oversold," as they are high on their charts.

Market breadth has not been particularly strong, but it does remain on a buy signal. This was the first indicator to turn bullish and it has progressed modestly since then. However, breadth hasn't been as strong as it normally is on an upside move of this size.

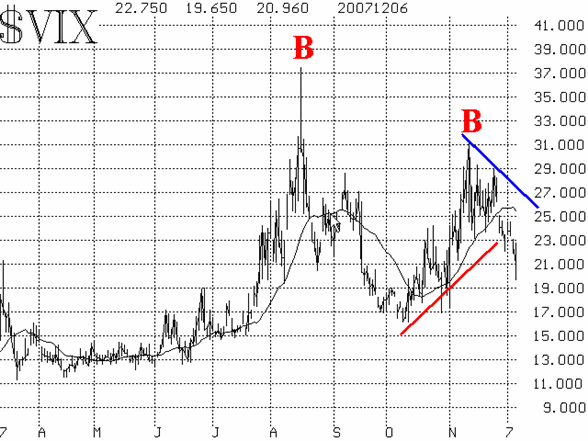
The volatility indices ($VIX and $VXO) have confirmed the bullishness, too. $VIX has continued to fall. What was previously an uptrend is no longer, and now $VIX is in a downtrend (that is bullish). It has closed below its 20-day moving average for several days, and that moving average has turned downward, confirming the bullish downtrend.

The reality of the current situation is that everything is bullish or nearly so. Perhaps some of the indicators aren't quite as strong as we'd like to see, but they are bullish enough to say that this market is going to move higher for a while.
Lawrence G. McMillan is the author of two best selling books on options, including Options as a Strategic Investment, recognized as essential resources for any serious option trader's library.
|