| Weekly Outlook in the Stock Market |
| By Price Headley |
Published
12/10/2007
|
Stocks
|
Unrated
|
|
|
|
Weekly Outlook in the Stock Market
NASDAQ Composite
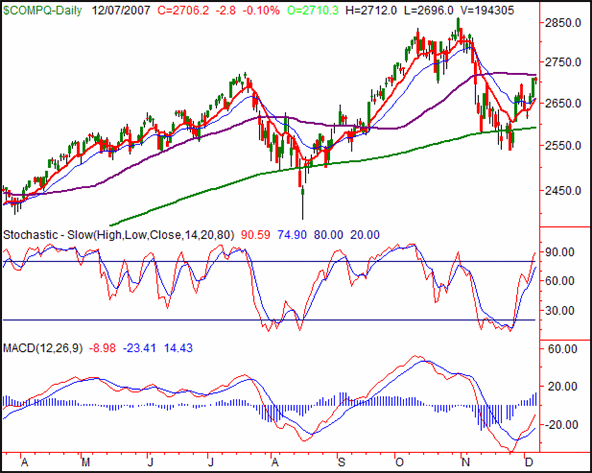
On Friday, the NASDAQ Composite slid 2.9 points lower (-0.1%) to close the day out at 2706.2. For the week, it still gained 45.2 point, or 1.7%, sustaining the rebound that began three weeks ago.
The thing we didn't see the composite do is break above the 50-day moving average line. It still might do so this coming week, but it almost seems as if the index is hesitating now that the question is at hand.
Part of the issue could be that we're nearly overbought (stochastically) now. This isn't to say the NASDAQ will for-sure stall here; we can get and stay overbought for a long time and see the market continue to rally right through it (see April and October). We're just saying we're not surprised to see a brief pause here.
If on the other hand the NASDAQ does break past the 50-day line, we'll have no choice but to be bullish. The MACD lines have already confirmed the bullish momentum.
Support remains at 2660, where the 10- and 20-day lines are.
NASDAQ Composite - Daily

S&P 500
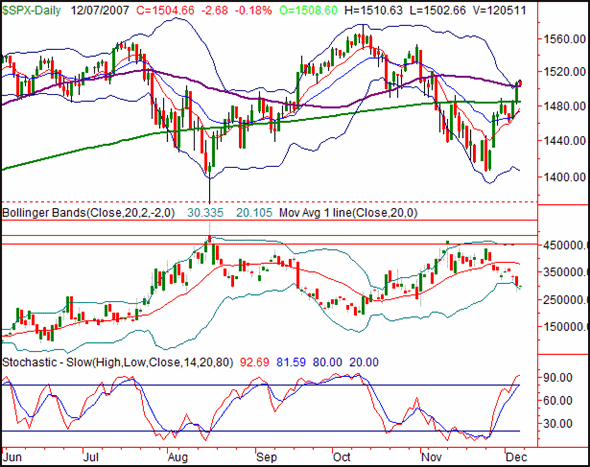
Friday's close of 1504.66 was 2.68 points (-0.18%) below Thursday's close, but 23.52 points (+1.59%) higher than the prior Friday's close. The index managed to get past some key ceilings on Thursday, but the lack of follow-through on Friday should concern the bulls.
At this point, the upper Bollinger band is a bigger concern than the SPX's 50-day average. Even then, it may not be too much of a concern. We just found it curious that the index hit it pretty hard on Thursday, and pressed into a short while on Friday before pulling back off of it.
Even so, we managed to close above the 50-day line here, and it's not like the upper band has done a great job with pushing the market back just yet.
Speaking of Bollinger bands, something similar applies to the VIX's bands. Specifically, the VIX's lower band line has yet to push the VIX backing the other direction either, even though it was met on Thursday.
Perhaps needless to say, this makes any call a tentative one. Both the VIX and the SPX could continue to press into their respective band lines, which would be bullish. Or, they could get pushed away from them, a bearish situation (which will happen eventually no matter what).
And did we mention that this chart is fully overbought according to our stochastic lines?
We're still more bullish than bearish here, based on the overall momentum.
S&P 500 - Daily

Dow Jones Industrial Average
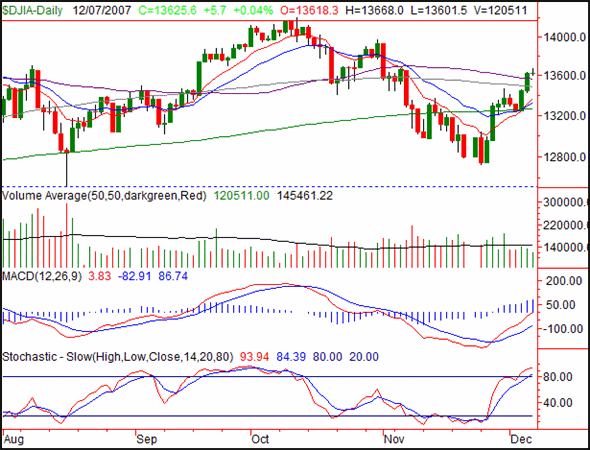
The Dow Jones Industrial Average was up 5.7 points (+0.04%) on Friday, closing at 13,625.6. For the week though, it led all indices with its 1.9% (+253.9 point) gain. More than that, the Dow has moved back above all of its key moving average lines. Or only issue with that is the reversal hint we saw on Friday, just one day after the big move that broke through all those key moving averages.
Ditto for the Dow everything we said about the other two indices above. The only thing we want to add here is the doji shaped bar from Friday. A doji is just an open and close at basically the same level, a hint that a tide has turned, or that the equilibrium has been met and the pendulum is set to swing the other way. And, with the Dow being as overbought as it is now in the wake of such a rapid run-up. It's not hard to entertain that possibility of a pullback.
But, the trend is our friend - at least until it's clear it shouldn't be. The great part about the Dow is how all of its key moving average lines are entangled, and should play a strong support role. The downside for this chart's bulls - and all the charts for that matter - is the lack of bullish volume we've seen during this rally. And, what little there is is actually getting weaker.
Dow Jones Industrial Average - Daily

Price Headley is the founder and chief analyst of BigTrends.com.
|