| Corcoran Technical Trading Patterns for December 12 |
| By Clive Corcoran |
Published
12/12/2007
|
Stocks
|
Unrated
|
|
|
|
Corcoran Technical Trading Patterns for December 12
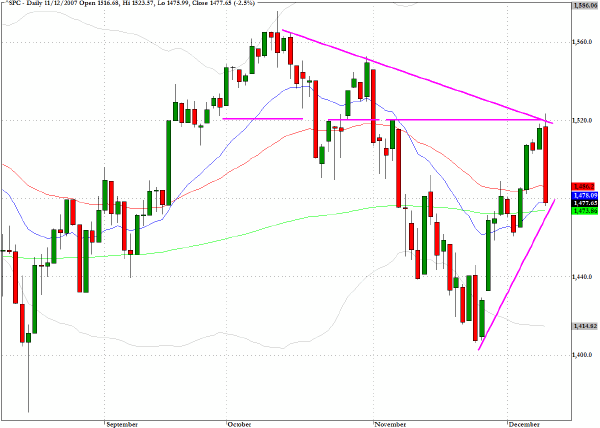
After briefly flirting with the 1520 level in early trading the S&P 500 (^SPC) ran into a barrage of selling which was exacerbated by the FOMC’s decision not to play Santa and deliver the 50 basis point cut that was not really expected but hoped for. In Monday’s column we reviewed the overhead trendlines that coincide in the region of 1520/30 and it is not too surprising that the bears were waiting patiently to ambush the rally that has carried the indices up throughout December.
Volume on the SPY proxy was the heaviest since the selling in late November and this serves to underline the fact that the volume readings during the earlier part of this month have been quite anemic.
I said on Monday that the market patterns have been somewhat confusing since the late November sell-off, primarily because of the degree of short covering and the relatively weak volume, and it is quite possible that there really could be renewed vitality for the bearishly oriented hedge funds following yesterday’s trading. However I would still be looking for a possible return to the 1525 level and if we can break through that key level we may still see new highs before 2007 is done.
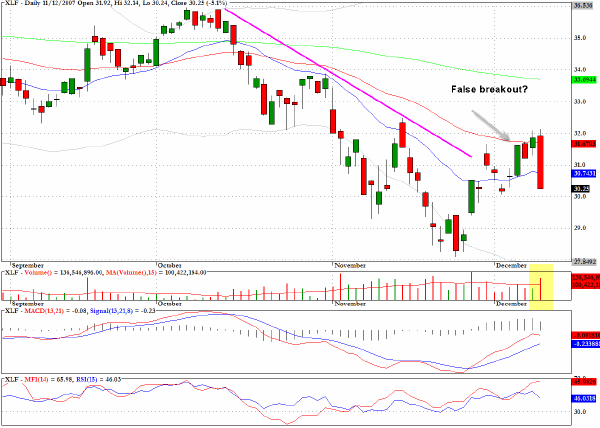
The major casualties in yesterday’s sell-off were the banks, homebuilders and mortgage related financial services companies. The banking index (^BKX) looked to be on the brink of a significant breakout above the 50-day EMA and descending trendline but slipped back quite abruptly yesterday. The chart for the sector fund for the financials, XLF, shows quite revealingly what could have been a breakout trap laid by the bears to ensnare the optimists that the worst news had already been discounted by the markets.
The setback for the sector is not too surprising and I had pointed this out in last Friday’s comments regarding the technical picture for the banking sector when I commented that "in the intermediate term the attainment of this level (i.e. the 50-day EMA) could provide trading desks with a cue to take some money out of the sector and could mark the point at which this rather remarkable rally could run into strong resistance."
So have we seen a false breakout? In the short term - probably yes. But longer term, while the fundamentals continue to look gloomy for the banks, the fact that sovereign wealth funds and petrodollars are being made available to re-capitalize the hapless banks and bail them out of their poor judgments should provide formidable underlying support near to recent lows.
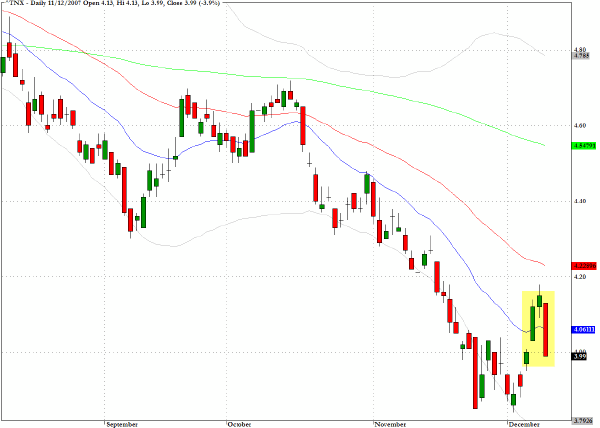
Treasury prices rallied strongly yesterday after Friday’s strong upward move on yields. There are undoubtedly many confusing cross currents at the moment and perhaps yesterday’s strength in bond prices had as much to do with changing perceptions by forex traders as they re-evaluate the dollar’s plight. A fifty basis point reduction would have knocked a big hole in the newly found confidence and belief from some currency traders that the dollar may be ready for an interim rebound.
TRADE OPPORTUNITIES/SETUPS FOR WEDNESDAY DECEMBER 12, 2007
The patterns identified below should be considered as indicative of eventual price direction in forthcoming trading sessions. None of these setups should be seen as specifically opportune for the current trading session.
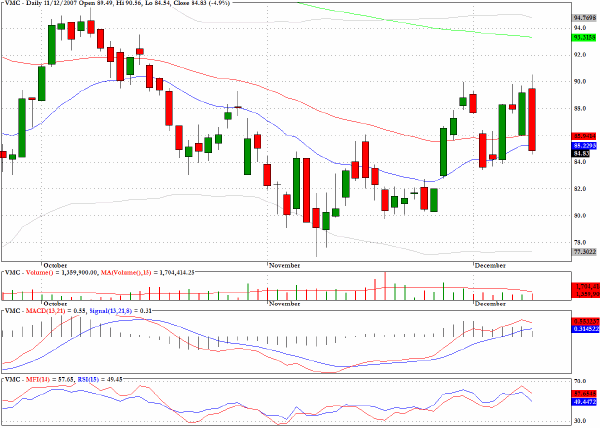
Legacy Vulcan (VMC) has returned to an area of potential moving average support.
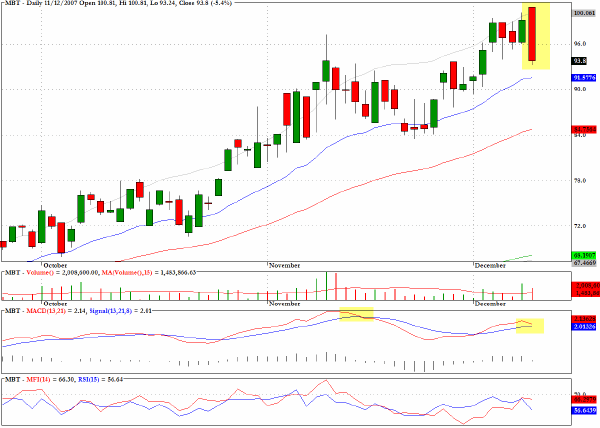
Mobile Telesystems (MBT) was cited on Monday as showing evidence of negative momentum (MACD) divergences as well as some evidence of distribution despite the recent higher prices. As commented this kind of dissonance can often precede a tradable correction.
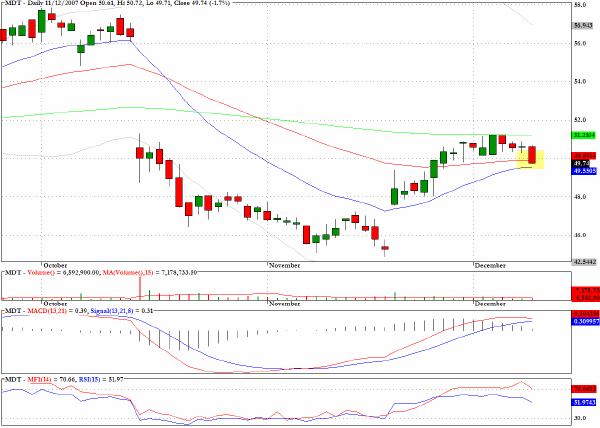
Medtronic (MDT) should find support near to yesterday’s close.
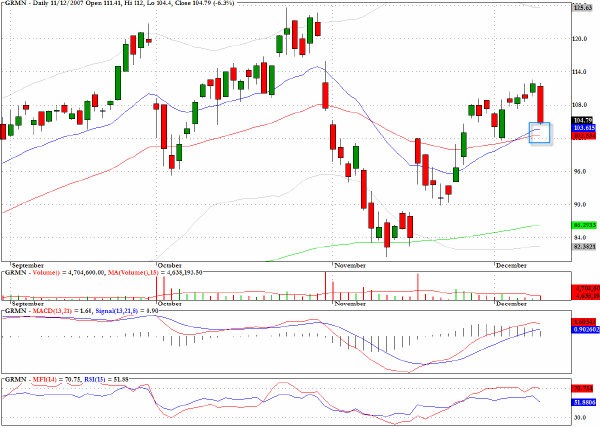
Although I have been bearish (largely from a fundamental point of view) on Garmin (GRMN) the present technical pattern looks reasonably constructive on the long side.
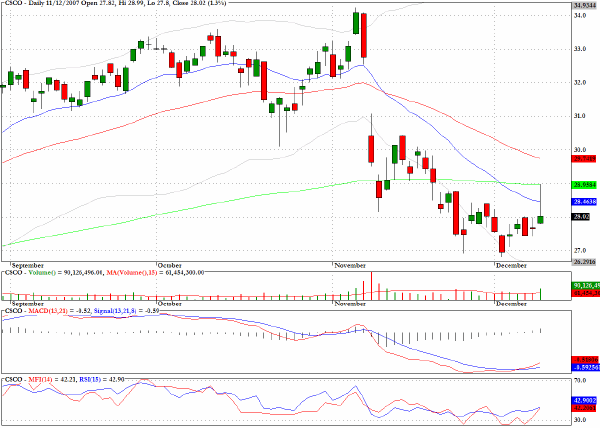
Cisco Systems (CSCO) showed on one of my pattern scans with a chart formation that shows that the recent weakness may have set the stage for a recovery effort.
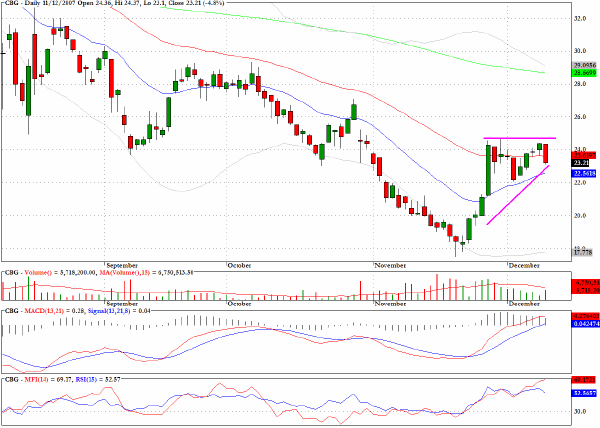
CB Richard Ellis Group (CBG) has an ascending wedge formation and this could be pointing towards an eventual test of the 200-day EMA near to $29.
Clive Corcoran is the publisher of TradeWithForm.com, which provides daily analysis and commentary on the US stock market. He specializes in market neutral investing and and is currently working on a book about the benefits of trading with long/short strategies, which is scheduled for publication later this year.
Disclaimer
The purpose of this article is to offer you the chance to review the trading methodology, risk reduction strategies and portfolio construction techniques described at tradewithform.com. There is no guarantee that the trading strategies advocated will be profitable. Moreover, there is a risk that following these strategies will lead to loss of capital. Past results are no guarantee of future results. Trading stocks and CFD's can yield large rewards, but also has large potential risks. Trading with leverage can be especially risky. You should be fully aware of the risks of trading in the capital markets. You are strongly advised not to trade with capital.
|