| A Mid-Week Look at the Market |
| By Price Headley |
Published
12/13/2007
|
Stocks
|
Unrated
|
|
|
|
A Mid-Week Look at the Market
NASDAQ Composite
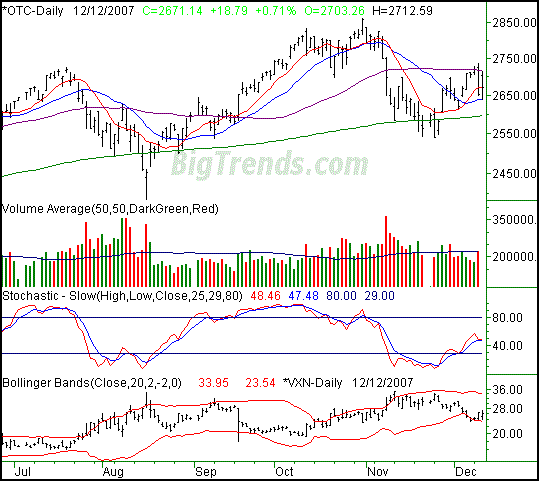
On Wednesday, the NASDAQ added 18.79 points, or 0.71%, to its total, bringing the index to a close of 2671.14. It's still down by 35.02 points, or 1.29%, so far for the week. More than that, the composite is very much caught between a rock and a hard place - there's resistance at the 50 day line, but support at the 20 day line.
The bears could actually make a pretty good case with today's chart. Volume was strong as we headed from a high open to a lower close, even if the index closed higher than Tuesday. And, stochastics flipped back into a bearish mode.
More than anything though, the fact that the VXN is starting to push up and off that lower Bollinger band line is a red flag.
But, the key for the Composite is the 20- and 50-day lines; they're the boundary lines.
NASDAQ Composite - Daily

S&P 500
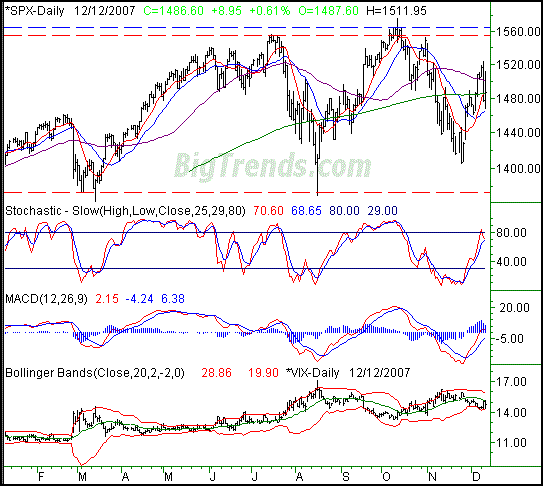
Wednesday's 8.95 point (+0.61%) gain pushed the S&P 500 up to 1486.60. Week-to-date, the large cap index is still down by 18.05 points, or 1.2%. More than that, the index is hovering around a collection of its key moving averages, unsure about where it wants to go next.
If we absolutely had to make a call here, we'd have to lean bearishly. Just barely though. Fortunately, we don't have to make that firm call just yet. We're still waiting for a stochastic or MACD bearish cross. We're ripe though.
Be patient here. Waiting is tough to do, but the risk/reward scenario isn't all that great right now. The SPX should breakout or breakdown soon enough.
S&P 500 - Daily

Dow Jones Industrial Average
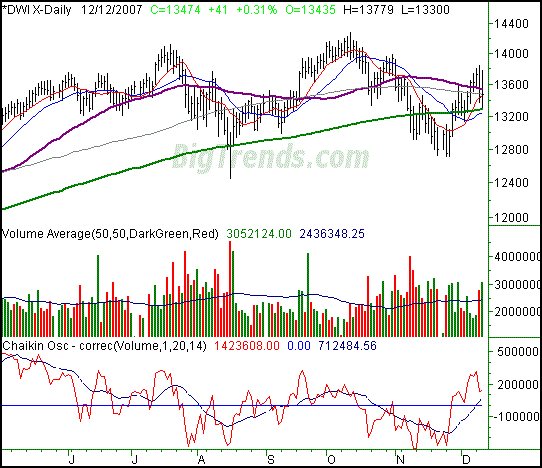
The Dow rallied by 41 points on Wednesday, a 0.31% gain that left it at 13,474. That's 152 points (-1.12%) below Friday's close though, so don't get too excited. In fact, the Dow's a lot like the other key indices right now, at a crossroads, framed by all of its key moving average lines.
The one thing that's very evident for the Dow right now is that it's struggling, a lot. The highs are getting lower, and the dips are coming with ease. The fact that the key moving averages are all within 200 points of one another validates the notion.
There is an upside to that; it's a windup for a fast pitch. It may end up being a bearish pitch, but it's still going to be better movement than what we have now.
The good news here is that it should be an easy 'tell'. Above the 50-day line at 13,534 is bullish, and below the 20-day line at 13,241 is bearish.
One thing we have observed for the Dow is that the Chaikin line (a volume-based momentum line) is 'working' again. The line in question is not the Chaikin line itself, but a moving average of said line. That's the blue dashed line following the red Chaikin line. What we're looking for is a directional change in the moving average. Right now it's pointed higher, but if it tips lower, it could spell trouble.
We'll back-test the concept and use it of it works. In the meantime, we're just looking for that turn in the volume tide.
Dow Jones Industrial Average - Daily

Price Headley is the founder and chief analyst of BigTrends.com.
|