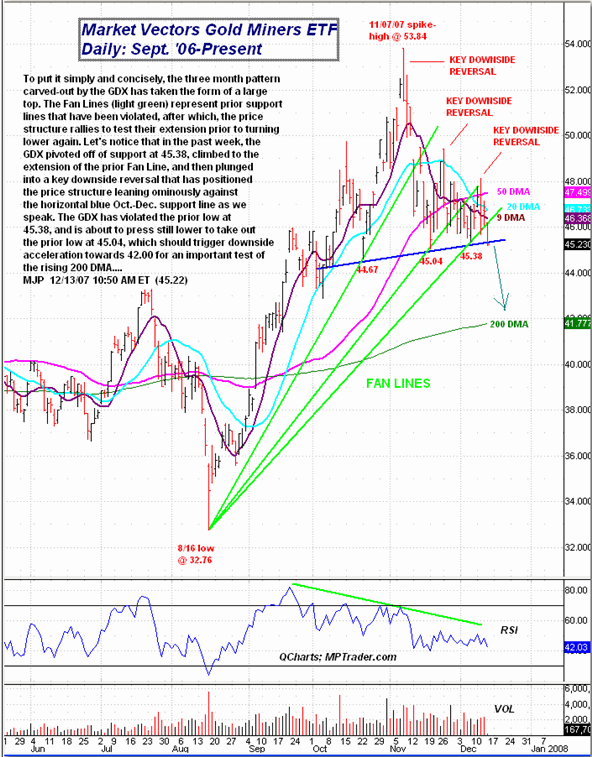
The three-month pattern carved out by the Market Vectors Gold Miners ETF (GDX) has taken the form of a large top.
How ironic that on a day that exposed outsized inflation data (PPI), gold prices are plunging, and so are the precious metal mining stocks. To put it simply and concisely, the three-month pattern carved out by the Market Vectors Gold Miners ETF (GDX) has taken the form of a large top. The Fan Lines (light green on the chart) represent prior support lines that have been violated, after which the price structure rallies to test their extension prior to turning lower again. Let's notice that in the past week the GDX pivoted off of support at 45.38, climbed to the extension of the Fan Line, and then plunged into a key downside reversal that has positioned the price structure leaning ominously against the horizontal blue Oct-Dec support line as we speak. The GDX has violated the prior low at 45.38 and is about to press still lower to take out the low prior to that at 45.04, which should trigger downside acceleration towards 42.00 for an important test of the rising 200 DMA. 
Mike Paulenoff is a 26-year veteran of the financial markets and author of MPTrader.com, a real-time diary of his technical chart analysis and trading alerts on all major markets. For more of Mike Paulenoff, sign up for a free 15-Day trial to his MPTrader Diary by clicking here.