| Weekly Outlook in the Stock Market |
| By Price Headley |
Published
12/17/2007
|
Stocks
|
Unrated
|
|
|
|
Weekly Outlook in the Stock Market
NASDAQ Composite
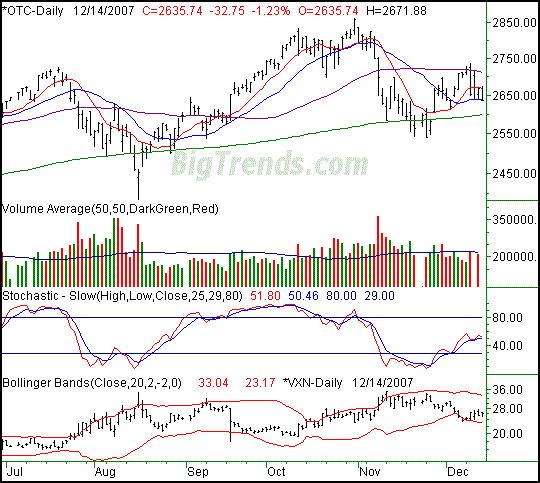
The market couldn't hang onto a good thing (again), as the NASDAQ fell by 32.75 points (-1.23%) to close at 2635.74 on Friday. That's a 70.42 point loss (-2.60%) for the week, and doesn't exactly bode bullishly.
You'll find this is true for the Dow and the SPX too, but the NASDAQ is trapped between some key moving averages. The 50-day line (purple) was a ceiling earlier in the week, and the 10-day line (red) at 2668 was the ceiling on Thursday and Friday. On the flipside, the 20-day average (blue) at 2639 was a floor Wednesday through Friday.
What's subtly bearish about this chart is not the NASDAQ itself, but the NASDAQ Volatility Index (VXN). Though we saw a lower range on Friday, it actually closed higher. In fact, it's closed higher 3 of the last five days, and has made mostly higher highs and higher lows after falling into -and bouncing off of - the lower Bollinger band on Friday and Monday. The fact that it's rising and still has much more room to rise suggests the NASDAQ itself has room to fall.
NASDAQ Composite - Daily

S&P 500
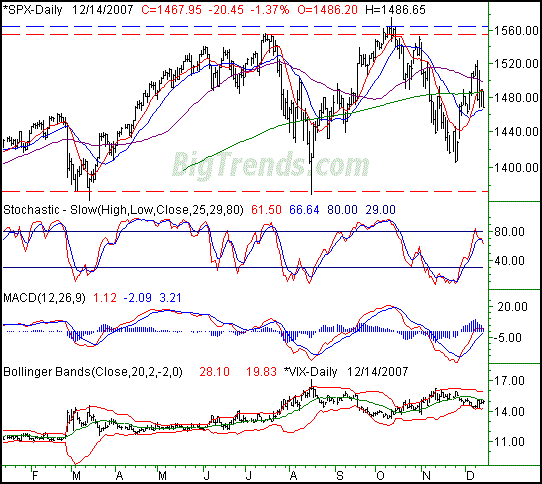
The S&P 500's 20.45 point (-1.37%) loss on Friday pulled it all the way back down to 1467.95. For the week, that translated into a 2.44% loss (-36.70 points). And as with the NASDAQ, it doesn't really suggest anything in the way of bullishness.
The only thing different we can point out for the S&P 500 is this: its long-term trading range is really becoming clear. More than that, we didn't even pressure the upper edge of the range. Instead we saw a lower peak of 1523 a couple of weeks ago. Not a positive.
One of the keys we've observed here is the 20-day average (blue), currently at 1465. Crosses of the 20-day line have been fairly effective indications of short-term swings. So, with the SPX really pressing the issue, we're curious about whether or not it can support the index come next week.
The trump card is expiration next week, though that alone won't prevent traders from exercising their will if they have enough conviction.
Two things to keep in mind: (1) this may be tax-loss selling, which may not be over yet, and (2) it wouldn't be wise to bet against a Santa Claus rally. Ideally, we'd satisfy both possibilities with a few more days of 'down', followed by a few days of 'up'. We're not counting on anything though, except what we see unfolding.
Support's at 1465.
S&P 500 - Daily

Dow Jones Industrial Average
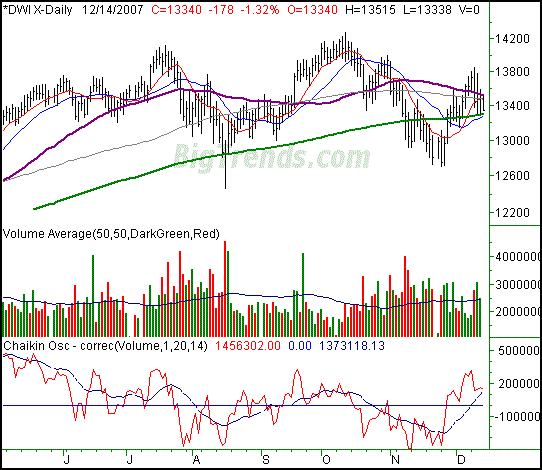
The Dow gave up 178 points (-1.32%) on Friday, leaving it at 13,340 by the end of the session. For the week it closed 2.10% lower, losing 286 points. The blue-chip index struggled with resistance over the last three days of the week, but in the bulls' defense, it also found meaningful support at the 200-day line.
In the MidWeek Update we mentioned we were going to look closely at the moving average of the Chaikin line as a possible 'tell' for the market's next move. Since the Chaikin line is a volume-weighted momentum indicator, and volume tends to shift before the market does, it stands to reason we could use the moving average of the Chaikin line (the moving average is the dashed line on our chart) as a decent predictor of the market's direction.
As it turns out, the idea isn't as strong as we first thought. It seems as if it works recently, but back-tested results are not all that great. We'll continue to play with it, and we'll let you know if we find anything. We just wanted to let you know in case you were looking to create a quantified system using the idea - it may not work as well as you'd hope. For now it just seems to be one of those indicators we'll just have to 'eyeball'.
Anyway, the NASDAQ has been unable to get back above the 50-day line (purple) since falling back under it last week. On the other hand, the 200-day line was support on Wednesday and Thursday. We'd call it being stuck between a rock and a hard place.
The upper of those two lines is at 13,512, while the lower is at 13,299. Let's use those as our lines in the sand here.
Dow Jones Industrial Average - Daily

Price Headley is the founder and chief analyst of BigTrends.com.
|