Intel Corporation (INTC) has retreated to a pivotal chart level and probable support from the 50-day EMA.
Friday's deterioration suggests that the test of the August lows in late November may not have been as conclusive as the bulls had hoped for. The reversal behavior following the FOMC statement and the need for concerted action by several central banks are underlining yet again the fragility of the financial sector. In such a climate it is not surprising that many fund managers refuse to believe that the biggest banking shocks have yet to be fully discounted by the market.
But stepping back from the tumult of last week the larger picture shows that the S&P 500 (^SPC) occupies the middle ground between the low of mid August and the recovery high in October. As the chart suggests there is a trading channel that has prevailed since the summer and this is reinforced from a technical perspective by the fact the all three key moving averages are converging in the center of that channel. Only eleven points separates the levels of each of the 20,50, and 200 day EMA's and Friday's close on the index at 1467, while it puts it below all three levels, still keeps the trading range hypothesis intact.
The problems in the money markets and the persistently high spreads between base rates and their equivalent LIBOR rates are definitely troublesome, but one would have to believe that central banks have become impotent, and that all rescue attempts are doomed, to conclude that we are headed towards some kind of financial Armageddon. Almost certainly there are some further large write-downs ahead but I suspect that in the near term long only fund managers will continue to take some comfort from the Fed's now obvious resolve and intent to prevent a systemic asset deflation. 
The chart pattern on the banking index (^BKX) now clearly illustrates the failure at the 50 day EMA level which I discussed last week. There was the now confirmed false break above the descending trend line and even one close above the 50 day EMA on December 10th but since then the index has sunk rather quickly and now seems to be ready to re-test the closing low of 88.12 from November 26. 
The Hang Seng index (^HSI) started the new week on a shaky note and moved down almost 1000 points or 3.5% and seems poised to check whether previous support at 26,000 which was touched on November 22nd is going to hold again. The convergence of the two shorter term moving averages in the proximity of 28,000 should now provide a firm barrier to any recovery efforts before the end of the year. 
Volume for the exchange traded fund XLF which comprises many of the larger players in financial services was anemic on Friday and I will be watching to see whether we get a pickup this week as we approach the previous low. 
In Friday's trading Synaptics (SYNA) validated the bearish interpretation of the chart pattern since early November that was discussed here about ten days ago. The lower high in late November, clear MACD divergences and the pullback channel set the stage for Friday's drop of more than six percent. 
AFFX rallied strongly in Friday's trading but came to rest at a level where resistance is likely to produce a tradable pullback. 
Air Products and Chemicals (APD) appears to be preparing to test the recent breakout and I would be a buyer as the stock approaches the $100 level. 
Intel Corporation (INTC) has retreated to a pivotal chart level and probable support from the 50-day EMA. 
The chart for Human Genome Sciences (HGSI) reveals a triangular pennant pattern which coincides with a chart resistance level. A directional breakout is imminent and I would suspect that it is upwards. 
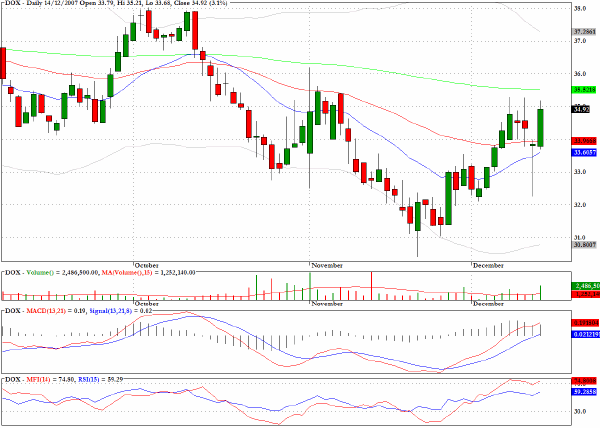
Amdocs (DOX) has rallied back to probable resistance from the 200-day EMA. 
Clive Corcoran is the publisher of TradeWithForm.com, which provides daily analysis and commentary on the US stock market. He specializes in market neutral investing and and is currently working on a book about the benefits of trading with long/short strategies, which is scheduled for publication later this year.
Disclaimer
The purpose of this article is to offer you the chance to review the trading methodology, risk reduction strategies and portfolio construction techniques described at tradewithform.com. There is no guarantee that the trading strategies advocated will be profitable. Moreover, there is a risk that following these strategies will lead to loss of capital. Past results are no guarantee of future results. Trading stocks and CFD's can yield large rewards, but also has large potential risks. Trading with leverage can be especially risky. You should be fully aware of the risks of trading in the capital markets. You are strongly advised not to trade with capital.