| Triangle Consolidation Pattern for Gold ETF (GLD) |
| By Mike Paulenoff |
Published
12/17/2007
|
Futures , Stocks
|
Unrated
|
|
|
|
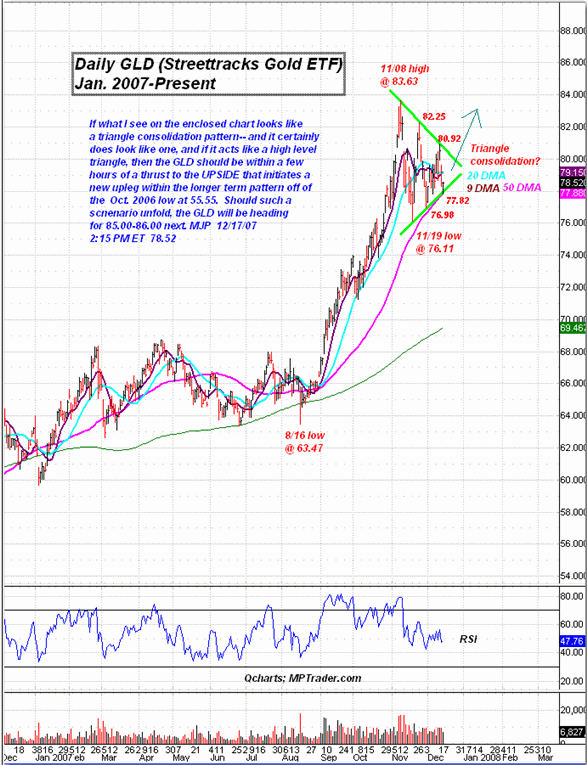
Triangle Consolidation Pattern for Gold
If what I see on the enclosed chart looks like a triangle consolidation pattern -- and it certainly does look like one -- and if it acts like a high-level triangle, then the GLD should be within a few hours of a thrust to the upside that initiates a new upleg within the longer-term pattern off of the October, 2006 low at 55.55. Should such a scenario unfold, the GLD will be heading for 85.00-86.00 next.

Mike Paulenoff is a 26-year veteran of the financial markets and author of MPTrader.com, a real-time diary of his technical chart analysis and trading alerts on all major markets. For more of Mike Paulenoff, sign up for a free 15-Day trial to his MPTrader Diary by clicking here.
|