Nucor (NUE) is also in the vicinity of all three moving averages as well as a pivotal chart level.
Continuing price erosion for the major equity indices in yesterday's session is now clearly signalling the fact that traders are preparing to test again the mid-August lows. Having retraced all of the early December gains the Russell 2000 (^RUT) is, as is often the case, leading the way from a directional point of view.
The small cap index actually broke below the August 15 closing low on November 26 (as well as the intraday low of August 16) and, after yesterday's two percent decline, less than five points further down on a closing basis would produce the lowest level on the index since early October, 2006. The economic outlook certainly suggests that we should no longer be expecting leadership from the small cap index, but having said that a failure to find support at this summer's low would be another negative development for the bulls. 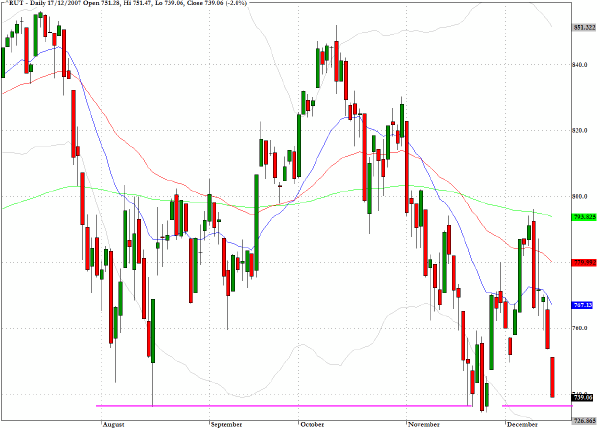
In terms of relative performance the Nasdaq Composite (^IXIC) is outperforming the small cap Russell 2000 as it is still more than 100 points above the mid August closing low. The Nasadaq index closed below the 200-day EMA yesterday and faces another chart support level at the early September and also late November lows at 2540.
Volume has been light during the last two down days and, in terms of assessing the likelihood of a successful rescue effort by the bulls with a seasonal rally into the holidays, it will be useful to monitor the volume characteristics during the remainder of this week as key chart levels are being tested. 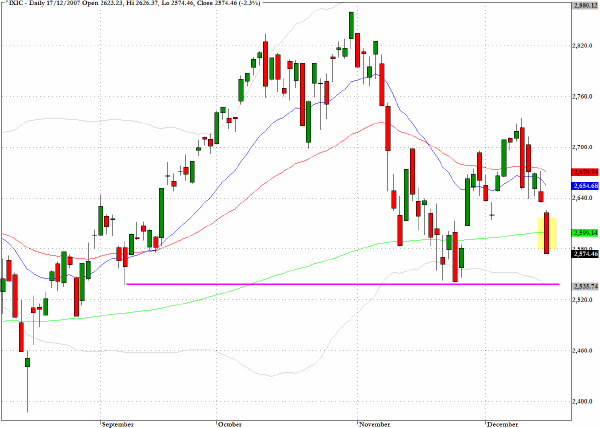
The chart pattern for the gold mining stocks (^GOX) reveals the descending wedge pattern that is often a precursor to a price breakdown. 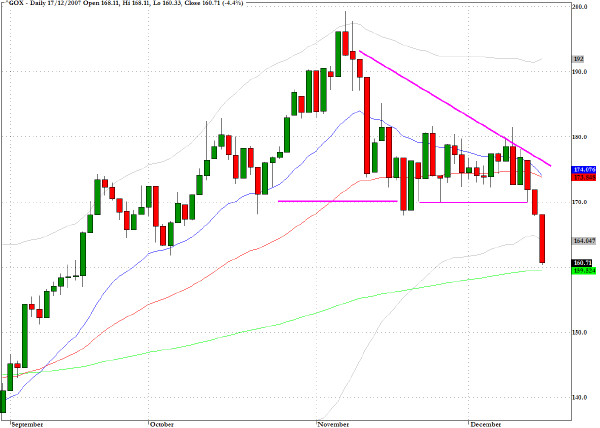
Yesterday's comment that "AFFX rallied strongly in Friday's trading but came to rest at a level where resistance is likely to produce a tradable pullback" proved to be timely. A good entry point was provided on the open and a short position could have produced a 5% return on the day. 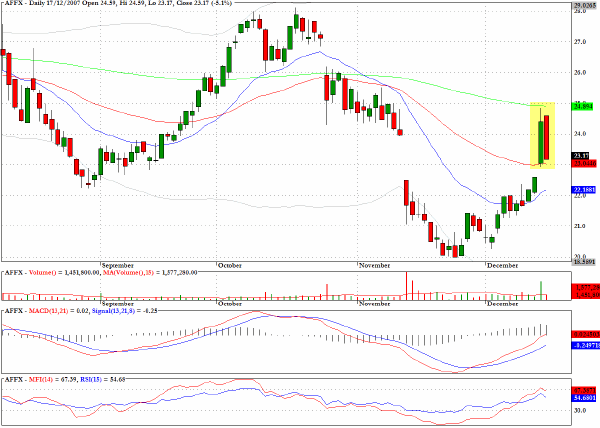
Sterlite Industries (SLT) which has caught my attention a couple of times this month finally succumbed to the clear negative divergences on the momentum chart and yesterday plummeted by more than ten percent. 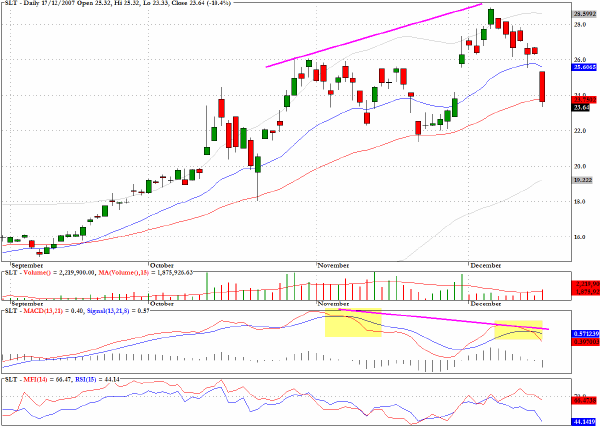
Pall Corp (PLL) could bounce off the intersection of all three moving averages. 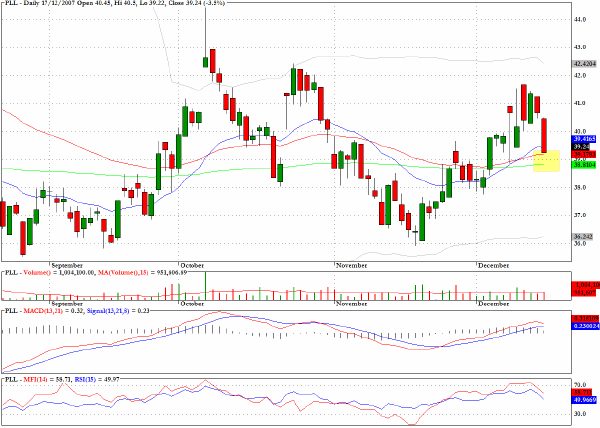
Nucor (NUE) is also in the vicinity of all three moving averages as well as a pivotal chart level. 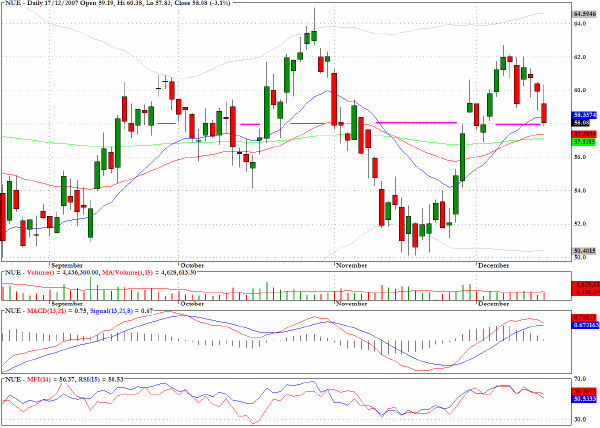
Merck (MRK) is approaching probable support that is reflected in the upward trendline and ascending price channel that has been in place since early November. 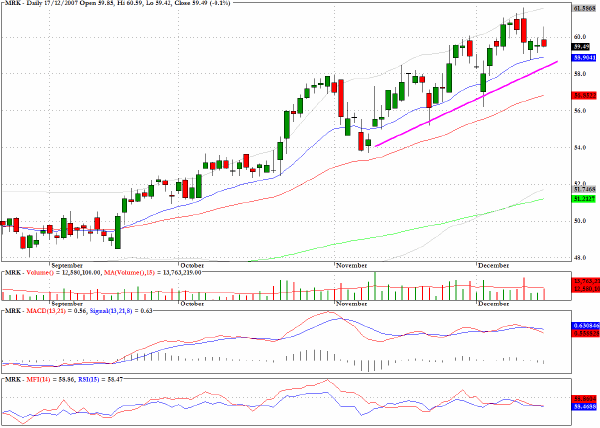
The chart for Dynegy (DYN) reveals positive divergences. 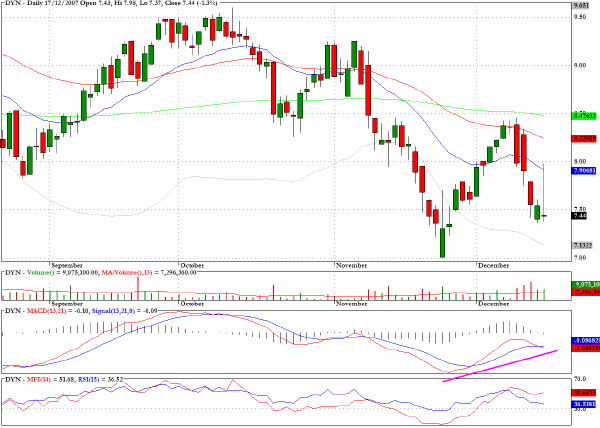
Clive Corcoran is the publisher of TradeWithForm.com, which provides daily analysis and commentary on the US stock market. He specializes in market neutral investing and and is currently working on a book about the benefits of trading with long/short strategies, which is scheduled for publication later this year.
Disclaimer
The purpose of this article is to offer you the chance to review the trading methodology, risk reduction strategies and portfolio construction techniques described at tradewithform.com. There is no guarantee that the trading strategies advocated will be profitable. Moreover, there is a risk that following these strategies will lead to loss of capital. Past results are no guarantee of future results. Trading stocks and CFD's can yield large rewards, but also has large potential risks. Trading with leverage can be especially risky. You should be fully aware of the risks of trading in the capital markets. You are strongly advised not to trade with capital.