| Weekly Outlook in the Stock Market |
| By Price Headley |
Published
12/26/2007
|
Stocks
|
Unrated
|
|
|
|
Weekly Outlook in the Stock Market
NASDAQ Composite
Most of our comments this week are about the Dow and the SPX, but we do want to point out a couple of things about the NASDAQ.
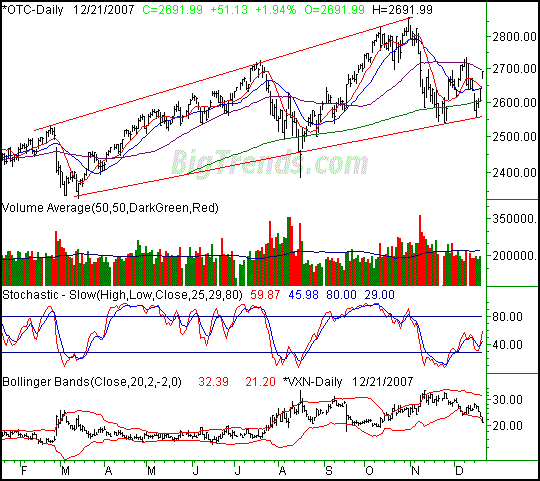
First, even with the big move on Friday, the NASDAQ is nothing more than a pinball, bouncing between the 200-day line (roughly) and the 50-day line (precisely). The gap from Friday just means the likelihood of another move lower is just that much better.
The other comment is a potentially bullish one. See the red lines framing the highs and lows going back to February? We just bounced up and off the lower one, so if these mean anything, the NASDAQ really could be headed higher. However, it doesn't necessarily mean it'll go there in a straight line.
By the way, that support line as at 2561. The resistance line is at 2900. Both are rising. The 50-day line (purple) is still the short-term key though.
NASDAQ Composite - Daily

S&P 500
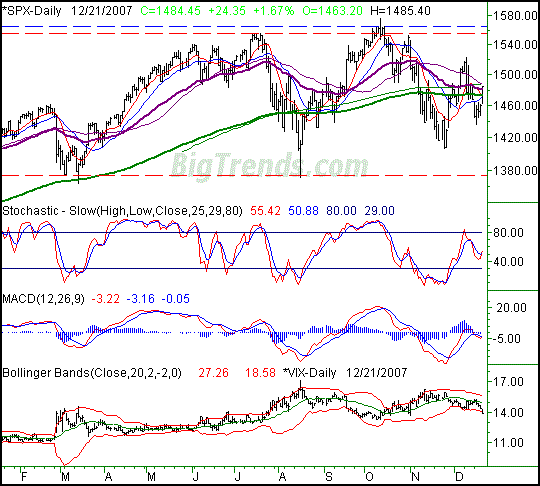
The S&P 500's 1.67% gain on Friday (+24.35 points) led to a close of 1484.45. On a weekly basis, the index was up 16.5 points, or 1.12%. Do the math here; Friday salvaged what was otherwise going to be a losing week. However, it's not like all is well for the SPX
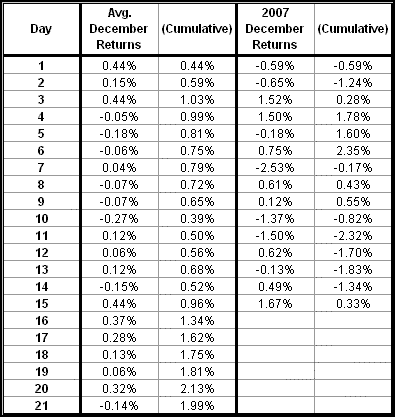
Remember Tuesday's TrendWatch "The Typical December"? In it we looked as what the normal day-by-day returns were for the S&P 500 during December. At the time the SPX was actually behind schedule, so it's interesting to see how much list time was made up the last three days of the week. Here's the updated chart:
December Daily Returns (S&P 500) - Past 20 Years

If you're a purist when it comes to the law of averages, there's still ground to be made up.
Our issue with the theory is just that there are some dangerous scenarios with 2007's December. The first and biggest is the VIX - it's strangely low. Expiration certainly played a role in that, but could it have really been that much of a factor? Even so, the VIX has been more prone to reverse at extremes rather than follow-through lately.
The other issue, the moving averages, is almost a taunt. They're all basically on top of one another, a sign that nobody's really sure what's next, and nobody's willing to take a decisive stance. Ultimately this is a good thing for traders, as explosive moves are born of a tightened collar. The direction of the explosion is still in question though. The calendar says it should be bullish, but that's the only thing saying that.
S&P 500 - Daily

Dow Jones Industrial Average
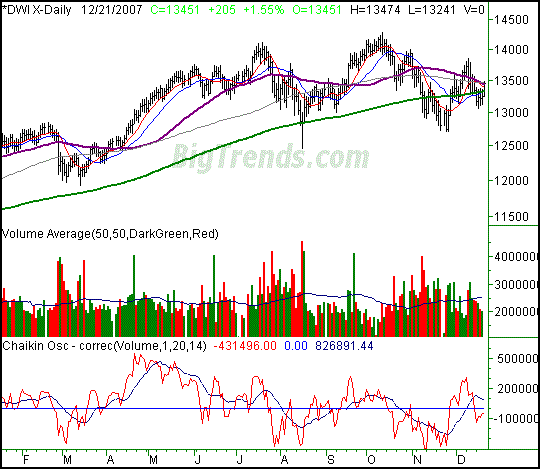
Nice 1.55% gain for the Dow on Friday - a 205 point move that left it at 13,451. For the week though, the Dow cut it close with a gain of 111 points (+0.83%). Even then, it's not like the Dow has pulled itself up by its boot straps. It hit a headwind at some key moving averages on Friday, and there's still a lingering issue with volume we can't put away just yet.
Remember the observation we made a few days ago about the Chaikin line and its moving average line? (That's the red line at the lowest part of the chart, and the moving average of it is the black line - overlaid.) The Chaikin line is just a volume-weighted momentum line. This is important information, as volume tends to start to hint at a move before the index actually makes that move.
Anyway, our conclusion (based on back-testing) was that the direction the moving average was pointed - up or down - was not a reliable way to make market calls. That hasn't changed since then; we can't quantify the Chaikin line to consistently make bull/bear calls. Nonetheless, we can't discard the data either.
As you can see, the moving average of the Dow's Chaikin line is indeed pointed lower. The Chaikin line itself is pointed higher as of now, but with the limited volume we've seen of late, that can change quickly.
In the meantime, and despite Friday, the 50-day line is dangerously close to falling under the 200-day line for the first time since late 2005. It did not precede a bear market then, so we can't jump to conclusions now. However, it is a concern, especially when we saw the Dow get halted at the 50- and 100-day averages on Friday.
Dow Jones Industrial Average - Daily

Price Headley is the founder and chief analyst of BigTrends.com.
|