| The McMillan Options Strategist Weekly |
| By Lawrence G. McMillan |
Published
12/28/2007
|
Options
|
Unrated
|
|
|
|
The McMillan Options Strategist Weekly
The 6-day rally that began in mid-December has apparently run its course, as the broad market took a tumble today. Nevertheless, there are some positive aspects in the technical indicators.
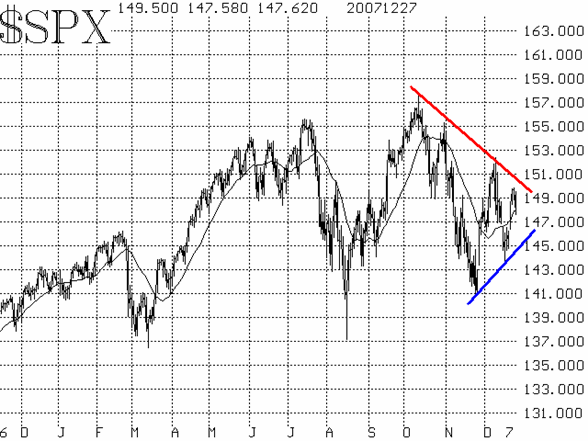
The chart of $SPX is the picture of a trading range. The wide trading range is between the extreme low closes at 1410 and the highs at 1560. But within that range, there are some trend lines that have developed (see Figure 1). These two trendlines define a range that is dampening down. That is, the oscillations in $SPX are getting smaller and smaller as it first bounces off the declining trend line and then the rising one. Technicians call this a triangle, although that is irrelevant. What is important is that a break of either trendline will likely be a catalyst for $SPX to make a substantial move from that point. So, roughly, a move above 1500 would be bullish and a move below 1450 would be bearish. We shouldn't have to wait long for that breakout to occur.

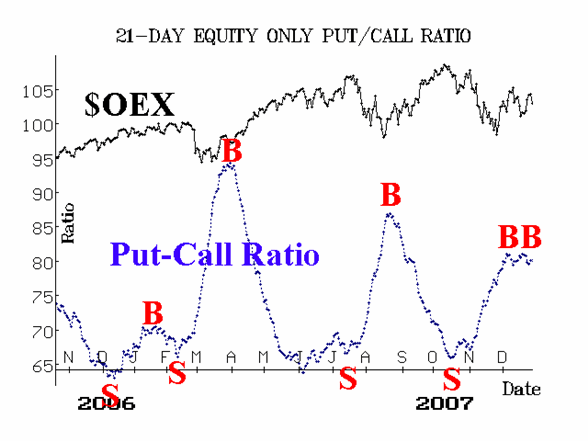
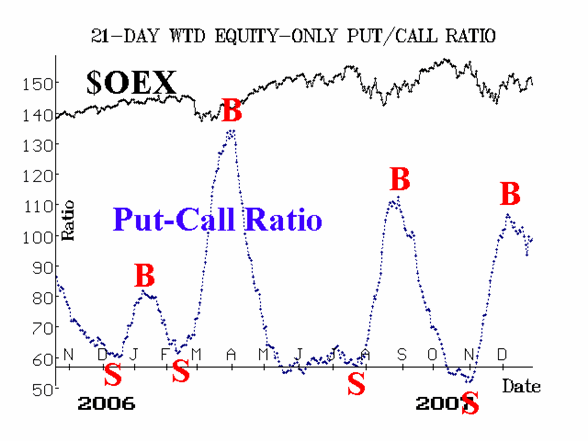
The equity-only put-call ratios are bullish. From Figures 2 & 3 you can see that buy signals are in place, although it wouldn't take a huge move to negate the standard signal.

Market breadth has generated a new sell signal, which is the only confirmed sell signal that we have right now.

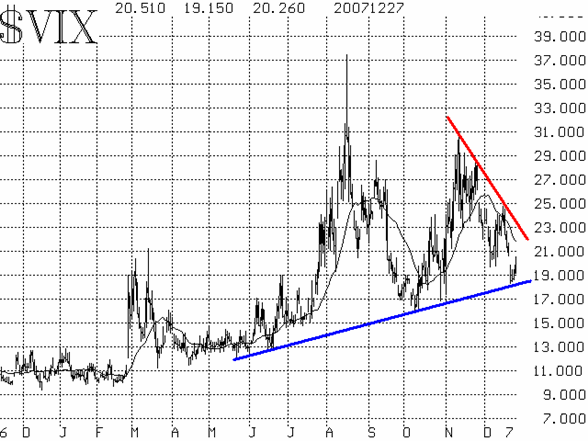
Finally, the volatility indices ($VIX and $VXO) have been declining, thus imparting a bullish interpretation for the stock market. However, the decline reached the lower, gently upward-sloping trendline (see Figure 4) and that might be the end of the decline in $VIX.

In summary, the technical indicators are somewhat bullish right now (the only true sell signal being breadths). However, there are some nagging, negative factors out there, and we'd want to see some resolution of those before going outright long.
Lawrence G. McMillan is the author of two best selling books on options, including Options as a Strategic Investment, recognized as essential resources for any serious option trader's library.
|