| Corcoran Technical Trading Patterns for December 28 |
| By Clive Corcoran |
Published
12/28/2007
|
Stocks
|
Unrated
|
|
|
|
Corcoran Technical Trading Patterns for December 28
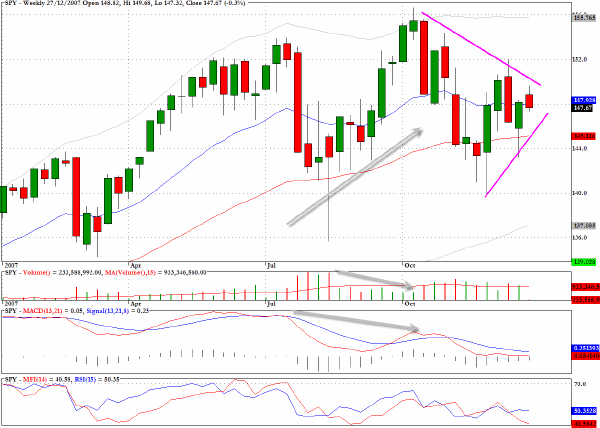
In this, our last commentary of 2007, I thought it would be useful to look at a weekly chart of SPY for the year. In particular the action over the second half of the year shows that despite dramatic day to day volatility the index was effectively gyrating within a clearly delimited trading range.
Of concern should be the negative divergences that have been marked on both the volume and MACD chart indicating that the recovery rally that followed the August sell-off was accompanied by far more subdued volume than was seen during the tumultuous trading of late July and August. The MACD indicator reveals a lower momentum peak being registered despite a break to a new historic highs for the index in early October.
The current triangular pattern, which is even more evident on the daily charts, is calling for a resolution in short order and it would not be surprising to see the index make its directional bias clear in the next few sessions.
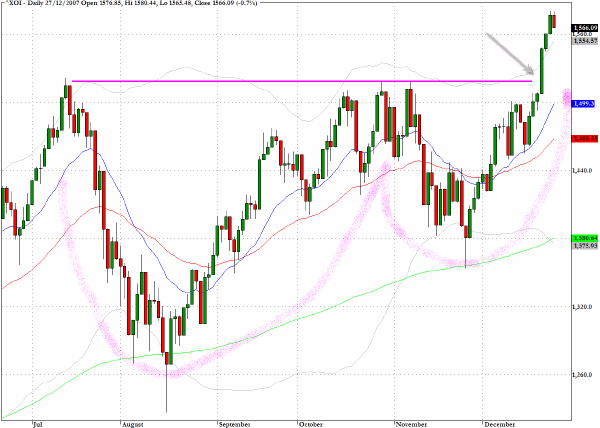
In last Friday's trading the Amex Oil index (^XOI) broke above the 1520 resistance level that marked the peak in July and also during the overall equity market recovery in October.
I have marked the outlines to a cup and handle pattern which is often seen as a precursor to breakout behavior for individual stocks and which appears to be supporting the interpretation that the large oil stocks are on the threshold of more advances as we enter 2008.
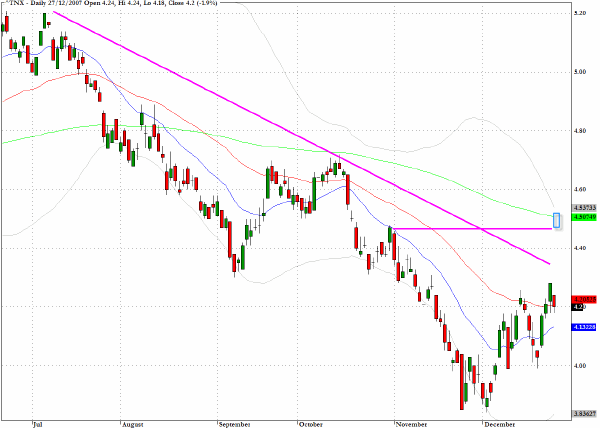
Yields on Treasuries have rebounded but now face a challenge at the descending trendline. The 4.4%/4.5% should confine any further erosion in bond prices as the economic data for December begins to percolate through in the new year.
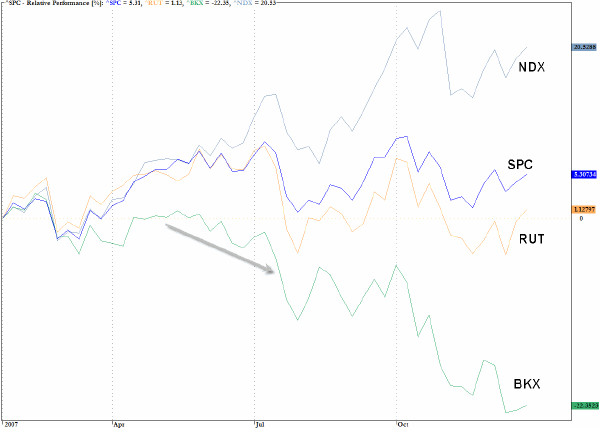
The most revealing feature of the chart below which captures the relative performance of several indices during 2007 is the clear divergence between the banking index and the recovery patterns of all of the broader market indices that followed the late February sell-off. Although many commentators and analysts expended a lot of energy during the second quarter brushing off the significance of the "sub-prime" issue, it is evident from the chart that many fund managers were selling the banks persistently throughout that quarter.
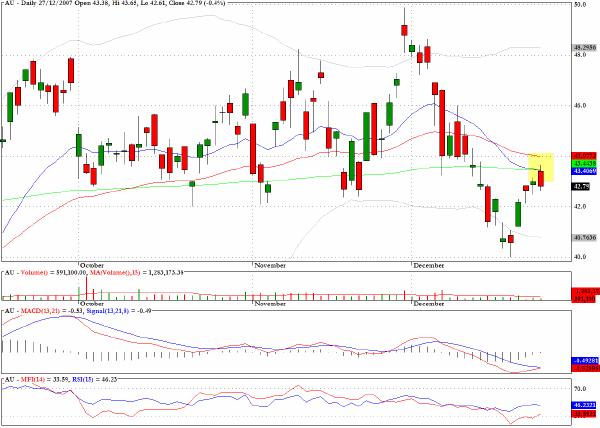
AngloGold Ashanti (AU) faces a hurdle in climbing back above all three moving averages.
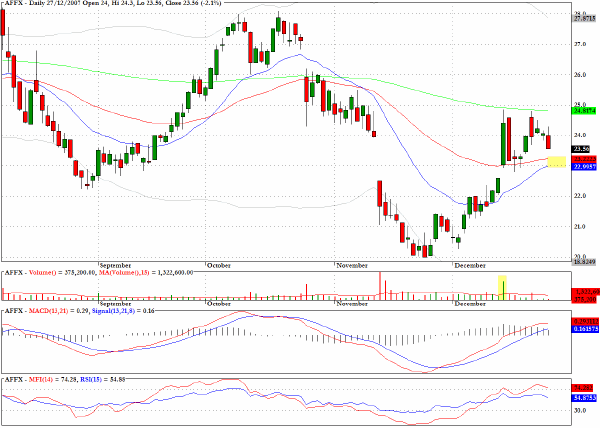
Affymetrix (AFFX) has pulled back to an area of potential support and I would be looking at the long side as the stock approaches $23.
Best wishes to all readers for a happy and prosperous 2008.
Clive Corcoran is the publisher of TradeWithForm.com, which provides daily analysis and commentary on the US stock market. He specializes in market neutral investing and and is currently working on a book about the benefits of trading with long/short strategies, which is scheduled for publication later this year.
Disclaimer
The purpose of this article is to offer you the chance to review the trading methodology, risk reduction strategies and portfolio construction techniques described at tradewithform.com. There is no guarantee that the trading strategies advocated will be profitable. Moreover, there is a risk that following these strategies will lead to loss of capital. Past results are no guarantee of future results. Trading stocks and CFD's can yield large rewards, but also has large potential risks. Trading with leverage can be especially risky. You should be fully aware of the risks of trading in the capital markets. You are strongly advised not to trade with capital.
|