|
2008 Market Indices Outlook
In yesterday's TrendWatch we took a look at our sector forecast for 2008, but today we wanted to take a step back and look at the potential scenarios for the broad market.
As always, there are no guarantees, as a lot can change over the next year. However, we have to start somewhere.
Being an election year in itself is likely to impact stock values. On average, during the last year of a Presidential term (also the election year), the Dow rises between 11% and 15%. Splitting the difference still means about a 13% gain, much better than the average.
Does that fit in with the Dow's technical analysis? Let's take a look.
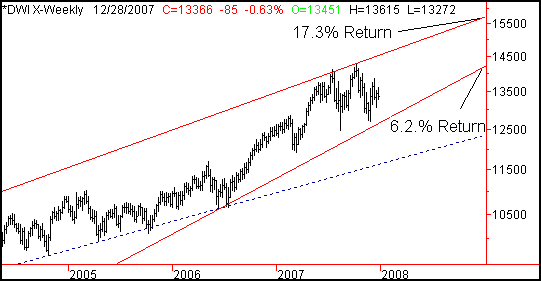
To really make this kind of long-term call, we need to zoom out to a weekly chart (which we did below). The two key trend lines we're seeing are red. The dashed line is a longer-term support line that, while meaningful, is a less likely scenario. Assuming those support and resistance lines remain intact, then the low-end likely return for 2008 is 6.2%, while the high-end is 17.3%. The average of those two possibilities is 11.75%, right in line with the election year projection.
Dow Jones Industrial Average - Weekly

In other words, the 11% to 13% range does look and feel plausible.
And what about valuation? The average trailing P/E for all 30 Dow components is 16.10, but the projection for the next twelve months is 14.10. This is in the middle of nominal levels; the average P/E for the Dow Jones Industrial average since 1950 is 16.6.
Historically, a P/E reading that's 'too high' is 22 or above, and 'too low' is under 10. That said, those extreme levels are actually rarely seen, yet the Dow can move up and down quite a bit and never actually reach those outside P/E readings. So, let's reel in the too high/too low levels to P/Es (respectively) 18 and 14. Even then, we're mostly on track. So, all seems to be acceptable on that front.
Still, it seems like there should be some interim methodology for measuring whether or not the market is 'worth it' based on forecasts. The best measure we see is to extrapolate the expected growth in earnings. With a current P/E of 16.10 but a projected P/E of 14.10, these companies are basically saying they foresee earnings growth of 14%.
Is it possible? Yeah, but I also think aggressive. On the other hand, stocks don't trade at what they're worth all the time; these companies could grow earnings only by 10%, the underlying stocks could still gain 11%, and the Dow's P/E could still remain under 18 despite it all.
Though I think the valuation measure is a possible sore spot, I also feel it won't be a major burden on the index.
All that being said, I do have to wonder if the election in 2008 is going to cause the 'norm' to be side-stepped. Despite George Bush's record-breaking unpopularity, the Democrats don't have the White House in the bag. Even more stunning is how the Dems have two very strong potential candidates, while the Republicans have no clear front-runner, at least not yet.
What's it matter? There are two issues in play here. The first one is change; the market doesn't like it, and clearly a move to a Democratic regime would be a far cry from Bush's brand of Republicanism. I think fear of change and a general fear of Democrats could spook Wall Street a little. Oh, yeah - don't forget most of W's tax cuts will go away in 2008, and the Democrats are apt to let it happen without a fight. Maybe a decisive Democrat victory will be a relief for a recently-troubled market, but the brief taste of a diminished tax burden could make voting Democrat a tough thing to do.
(The irony here is that the market tends to perform better under Democrats than Republicans, somewhat saying the fears are unfounded. Of course, 2008 isn't a new administration year; it's the last year of the old administration.)
It may be a little too soon in the game for investors to worry about who will win the White House. I know I wouldn't make any bets yet. Watch this dynamic as the story unfolds though; the impact of the election will grow as it becomes clearer who's winning the campaign.
In any case, let's make some projections for the S&P 500 as well as the NASDAQ.
The SPX's weakness in 2007 - compared to the NASDAQ's and even the Dow's - was just bizarre. A 3.5% gain? The trouble is, when I look at the chart, I don't see a whole lot more than that to get excited about.
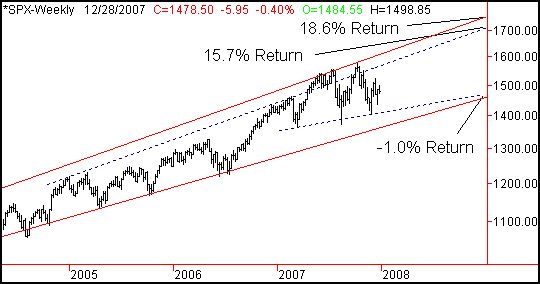
On the chart below, the outside highs and low (red lines) suggest a low-end return of about 1.0%, and a high-end possibility of 18.6%. The more immediate 'cone' of movement suggests the same low-end return of -1.0%, and a high-end result of 15.7%.
S&P 500 Weekly

This is a bit of a problem - the median return for the S&P 500 could be somewhere around 8%. Either the chart's recent (and not so recent) history means very little, or large caps are in trouble. And considering they've been surprising leaders for many months now, it wouldn't shock me to see them start to lag, as they have been of late. Maybe there's a small or mid cap opportunity hiding behind this chart?
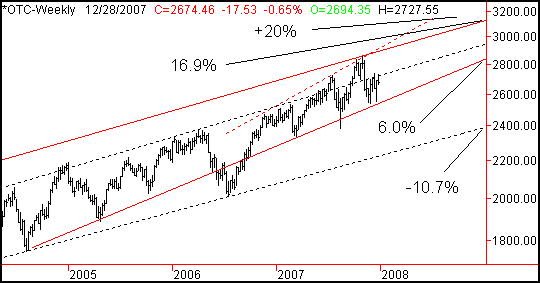
As for the NASDAQ, technical analysis of its chart reveals a world of possibilities, most of which are red hot or ice cold. I can't even get into the theory behind all of them; just keep in mind the red lines are the primary lines, and the dashed ones are secondary. The red, dashed line on this particular chart is a 'long shot' bullish possibility. The likely high-end return is around 16.9%, and the low-end possibility is 6.0%. The extreme ends of that range are a gain +20%, and a loss of 10.7%. Personally, I'd focus more on the primary (red) lines for this chart.
NASDAQ Composite - Weekly

By the way, the NASDAQ 100's current P/E is 38.7. Before you jump to conclusions, also bear in mind that it was over 200 in late 1999. So we could see much more froth before hitting a headwind.
On the other hand, even by historical standards, that's pretty high. The aggregate projected P/Es suggest these biggest NASDAQ-traded companies are going to increase earnings by 35%. A lot of nay-sayers say it can't happen, and I understand the reasons why they think so. However, never say never. Besides, a stock's 'worth' and a stock's 'price' rarely meet.
Either way, a lot of planets will have to line up if the NASDAQ is to have another outstanding year.
Price Headley is the founder and chief analyst of BigTrends.com.
|