| Corcoran Technical Trading Patterns for January 2 |
| By Clive Corcoran |
Published
01/2/2008
|
Stocks
|
Unrated
|
|
|
|
Corcoran Technical Trading Patterns for January 2
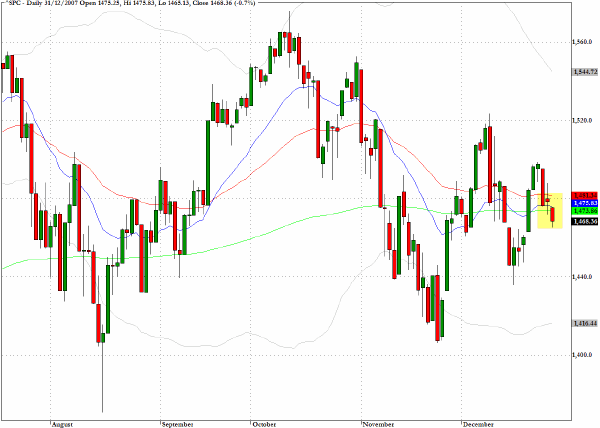
The last trading day of 2007 saw another downbeat session which brought the S&P 500 to a close just below all three key moving averages. The trading range persists and a directional breakout, which is now becoming overdue, may appear later this week with the release of employment data for December.
The TradeWithForm.com pattern recognition based Long/Short trading system concluded 2007 with a 20.5% return and a Sharpe Ratio value of more than three. This contrasts with a 3.5% return for buying and holding the S&P 500 throughout the year(excluding dividends) and, as if to highlight the difficulties for long only investment strategies, this S&P 500 buy and hold strategy would have endured a disappointingly low 0.4% Sharpe ratio reflecting the erratic trading conditions of 2007.
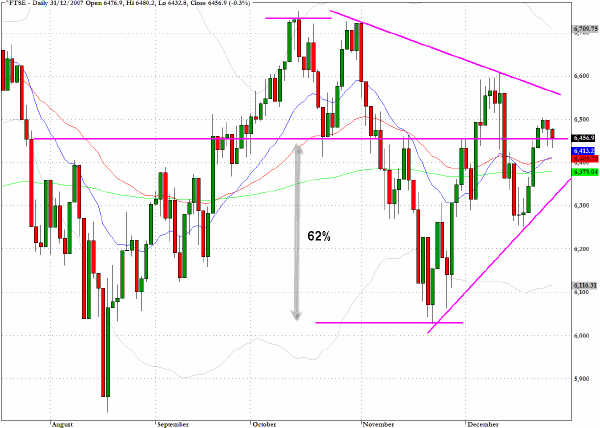
The FTSE index in the UK closed out the year at 6457 in a shortened trading session on Monday. Putting modesty aside I wanted to cast back to early December when I was a guest analyst on CNBC’s European Closing Bell and cited this exact figure as being a highly significant chart level. For readers of the Daily Form commentary on December 5, this is what I said.
"One of the more interesting indices at present and one that I shall focus on in my guest analyst slot today on CNBC’s European Closing Bell is the UK’s FTSE 100. The chart level that I have drawn represents the 6457 level which, as is apparent passes through several recent intraday highs where resistance has been encountered. This level sits exactly at the 62% retracement of the swing high in October and the swing low in late November. Penetrating above this level will be a real test for the bulls."
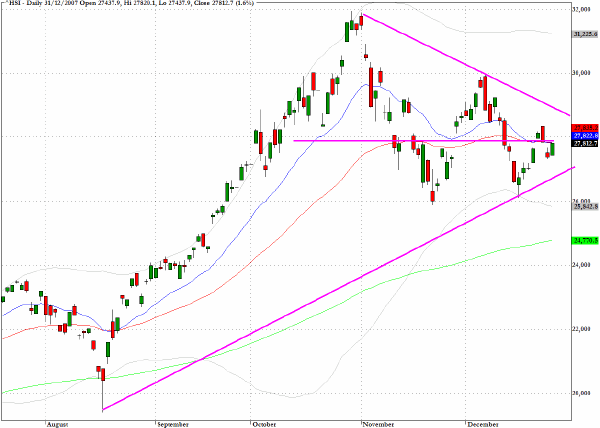
One other chart that shows a remarkably symmetrical close for the year that has just passed is for the Hang Seng index (^HSI) in Hong Kong.
TRADE OPPORTUNITIES/SETUPS FOR WEDNESDAY, JANUARY 2, 2008
The patterns identified below should be considered as indicative of eventual price direction in forthcoming trading sessions. None of these setups should be seen as specifically opportune for the current trading session.
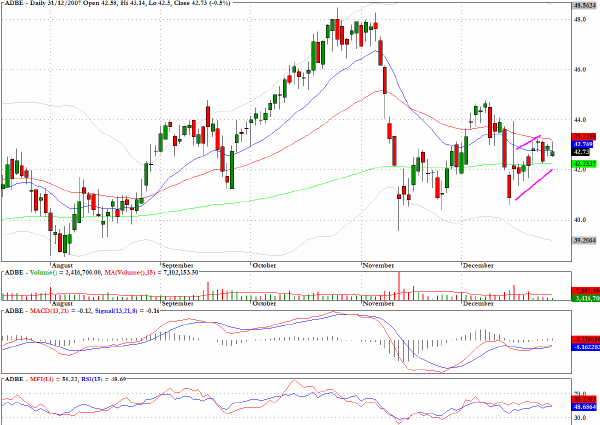
Adobe Systems (ADBE) has a bearish flag formation
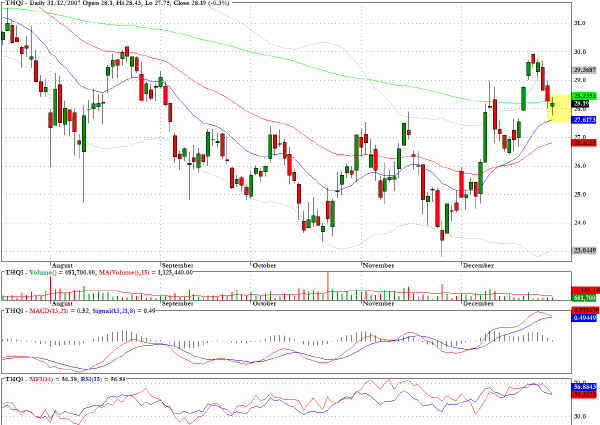
THQI has pulled back towards probable support at the 200-day EMA.
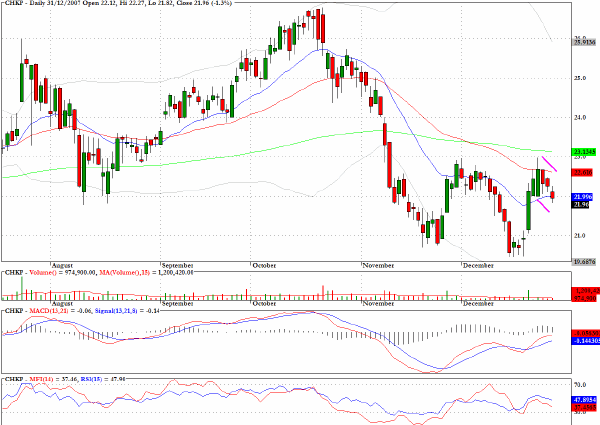
The daily chart for Checkpoint (CHKP) reveals a positive MACD divergence in association with the late December price weakness and evidence of a bullish pullback pattern.
Clive Corcoran is the publisher of TradeWithForm.com, which provides daily analysis and commentary on the US stock market. He specializes in market neutral investing and and is currently working on a book about the benefits of trading with long/short strategies, which is scheduled for publication later this year.
Disclaimer
The purpose of this article is to offer you the chance to review the trading methodology, risk reduction strategies and portfolio construction techniques described at tradewithform.com. There is no guarantee that the trading strategies advocated will be profitable. Moreover, there is a risk that following these strategies will lead to loss of capital. Past results are no guarantee of future results. Trading stocks and CFD's can yield large rewards, but also has large potential risks. Trading with leverage can be especially risky. You should be fully aware of the risks of trading in the capital markets. You are strongly advised not to trade with capital.
|