Good morning! The market forgot to take its lithium on Monday. The day began with a decent upside gap into the open that propelled the indices over their 15 minute 20 sma support. This triggered the 30 minute Reverse Head & Shoulders pattern in the SP500 that we were looking at yesterday for an initial morning setup. The buy pattern followed through very well, putting in an equal move on the 30 minute charts as compared to the move out of "the head" on the 18th. This also brought that index into its 20 day sma resistance and took the NASDAQ into the highs from the latter part of last week.
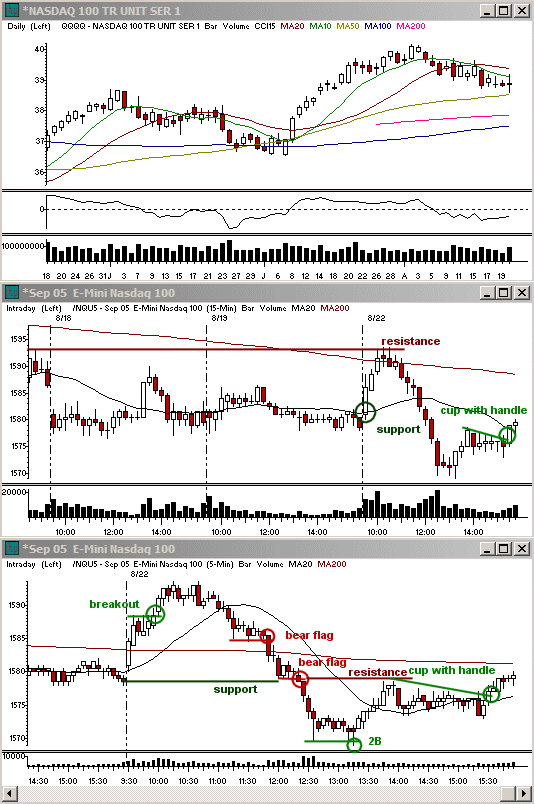
From that point on, the market took a swan dive. After rounding off at highs and initially teasing us with the potential for a 15-30 minute Bull Flag, the pace within the range turned over to favor the lower end of the range at the highs of the day. That very quickly gave way to a break in the 5 minute 20 sma support and the market continued with an Avalanche in the SP500 by basing with declining volume as the morning came to a close before breaking down into the 15 minute 20 sma and then filling the gap zone. This larger time frame support is typically a strong one, but with only two waves of selling intraday, there was still room for another. This came after another rather short base at lows at 12:00 ET. I was hoping to get a more obvious pullback into the 5 minute 20 sma for a breakdown, but the follow through was still strong, taking the NASDAQ through the support from the range last week at lows and into its 50 day moving average support.
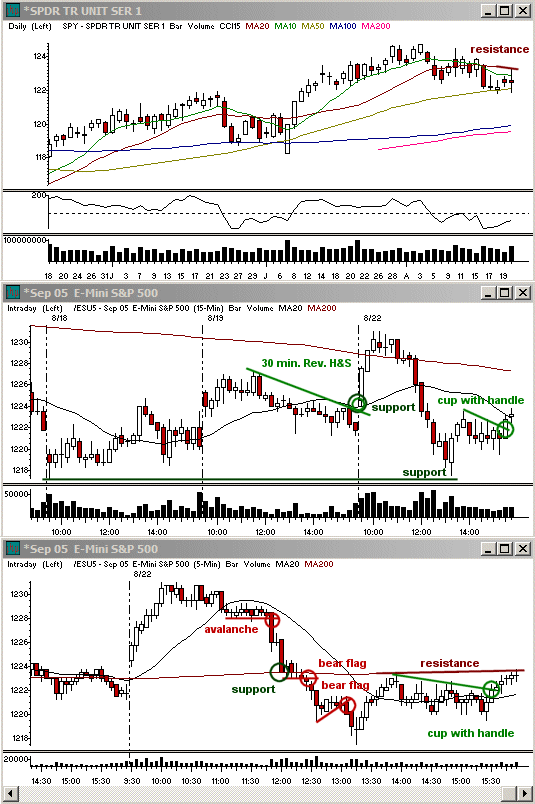
After three waves of selling in on the 2-5 minute charts, I expected a larger correction into the afternoon. The SP500 and Dow did try the lows from the 18th, but the NASDAQ formed a strong 2B pattern by only breaking the 12:30 zone lows by a tick, creating a type of double bottom. This rounding off allowed for a strong bounce into the 14:00 ET reversal period and back to the level of the 30 minute breakdown. It was also the 5 minute 200 sma in the SP500. At that point I began looking for a 5 minute Phoenix or Cup with Handle, but the range along resistance continued for a bit longer to form the pattern on a 15 minute chart instead, setting up with just 30 minutes left in the day. The pattern was followed by a gradual move higher into the close.
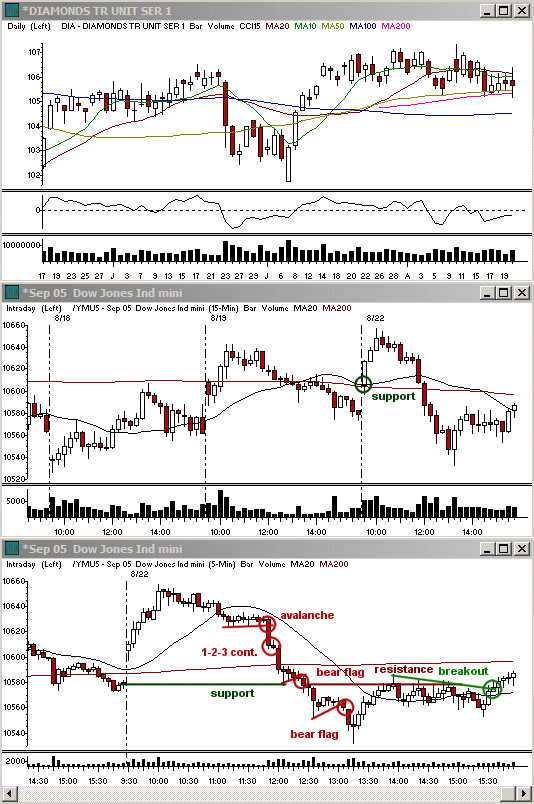
While we did see some decent trending action intraday, the market is still holding the larger daily range and correction off the highs made early this month. The NASDAQ looks strong going into Tuesday, but the SP500 and Dow Jones Ind. Ave. aren't forming similar setups on the 60 minute charts. They can just as easily break lower. Overall the entire market still has room for more selling as the week progresses. The 20 week sma is the next main support for all three of these indices and I am expecting that to hit by the end of the month, but to do so on a continuation of the choppy daily action we have seen recently.
Updates: I am watching HSP for a breakout on the daily and weekly charts, but it can easily take a few weeks to even a few months to develop with the 20 week and 20 month simple moving averages serving as support. QLGC is on my watch list as a longer term short on a break down out of the current weekly low-level base. For swingtrades, INFY broke down on Monday and hit initial support at the 100 day moving average zone. The 50 day sma will serve as resistance. AMT and WWY from Monday have also triggered daily breakouts on the upside and the 20 sma zone will serve as support.
Economic Reports and Events
Aug. 23: Existing Home Sales for Jul. (10:00 am)
Aug. 24: Durable Orders for Jul. (8:30 am), New Home sales for Jul. (10:00 am)
Aug. 25: Initial Claims 08/20 (8:30 am), Help-Wanted Index for Jul. (10:00 am)
Aug. 26: Mich. sentiment-Rev. for Aug. (9:45 am)
Aug. 29: -
Aug. 30: Consumer Confidence for Aug. (10:00 am), Factory Orders for Jul. (10:00 am), FOMC Minutes (2:00 pm)
Earnings Announcements of Interest
Only stocks with an average daily volume of 500K+ are listed. List may not be complete so be sure to always check your stocks' earnings dates before holding a position overnight. (A) = Earnings after the close, (B) = Earnings before the open, (?) = Earnings time not specified at the time of this writing
Aug. 23: WSM (B), WIND (?)
Aug. 24: BHP (?), CWTR (?), DLTR (B), INTU (A), MIK (A), PTR (A), PETM (A), TIVO (A)
Aug. 25: AVNX (4:00 pm ET), CHS (A), CMOS (A), DG (B), LTXX (A), OVTI (A), PDCO (B), PETC (A), SFD (B), TOL (?)
Aug. 26: -
Aug. 29: -
Aug. 30: ADCT (A), SMTC (A)
Toni Hansen is President and Co-founder of the Bastiat Group, Inc., and runs the popular Trading From Main Street. She can be reached at Toni@tradingfrommainstreet.com.


 Free Festival of Traders Videos