| The McMillan Options Strategist Weekly |
| By Lawrence G. McMillan |
Published
01/4/2008
|
Options
|
Unrated
|
|
|
|
The McMillan Options Strategist Weekly
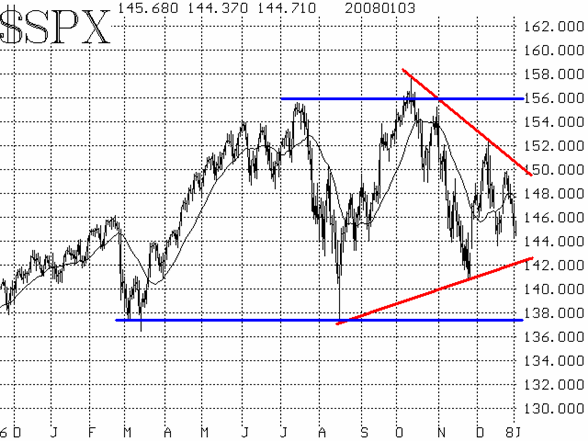
The stock market has been in a rather ugly funk since Christmas. In four consecutive trading days, $SPX lost a total of 50 points.Somewhat surprisingly, this decline has not convincingly thrown the indicators into a bearish mode, but it has certainly hurt the bullish case.
The $SPX chart is still a neutral one, despite the recent losses.The index remains within a large triangle (see Figure 1, red lines). Or, from an even wider perspective, $SPX is in a large, volatile trading range (blue lines on Figure 1). Near-term, a violation of support at 1440 (this week's lows) will likely lead to a quick retest of the 1410 level. A drop below there would likely mean that a bear market has begun. On the upside, there is resistance at a variety of previous tops, from 1500 all the way up to 1560.

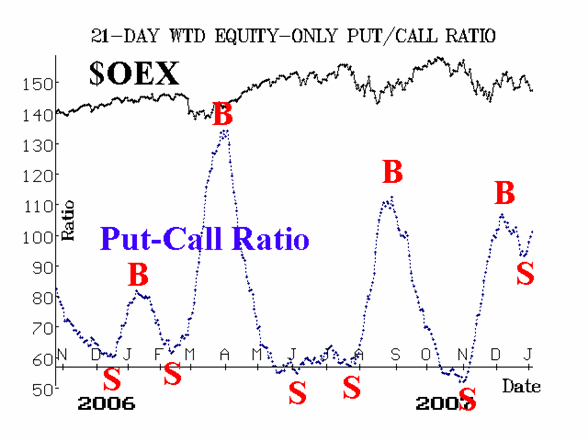
The equity-only put-call ratios (Figures 2 and 3) have not followed through on their buy signals from about a month ago. In fact, both ratios have now turned upward. That cancels out the buy signals and throws these indicators back into a sell signal. At the least, this means that a new stock market bottom will have to form; at worst, it means much lower prices lie ahead for stocks.

Breadth is negative, but has yet to reach oversold territory --a prerequisite to setting up an eventual buy signal.

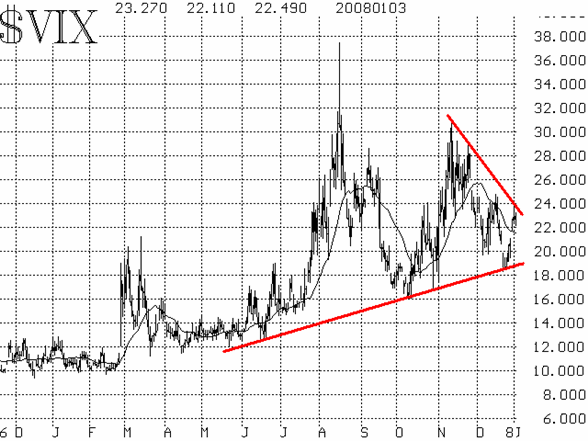
Finally, the volatility indices ($VIX and $VXO) are following a pattern similar to $SPX: they are in a wide triangle, and until they definitively break out of that triangle, they can be considered more or less neutral. A close by $VIX above 24 would be bearish.

In summary, the put-call ratios and breadth are negative. All that's awaiting final confirmation of an all-out bearish signal is 1) a $VIX close above 24, and 2) an $SPX close below 1440.
Lawrence G. McMillan is the author of two best selling books on options, including Options as a Strategic Investment, recognized as essential resources for any serious option trader's library.
|