| Corcoran Technical Trading Patterns for January 4 |
| By Clive Corcoran |
Published
01/4/2008
|
Stocks
|
Unrated
|
|
|
|
Corcoran Technical Trading Patterns for January 4
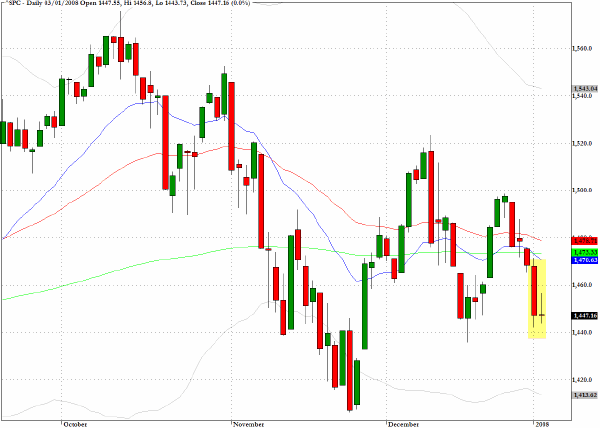
Attempts to mount a modest rally met with resistance and a lack of enthusiasm from the bulls in yesterday's session. The chart pattern for the S&P 500 (^SPC) provides a good insight into the mindset of most traders as they prepared for the release of today's employment data.
The narrow range, doji formation with an extended upper shadow also qualified as an inside day and underlines the hesitation and indecision as we approach a potentially market-moving session. Having backed itself into the furthest reaches of the apex of an extended triangle, the benchmark index appears to have run out of room for procrastination and a decisive move is to be expected today.
Despite evidence of technical weakness and the poor dynamics of the October 2007 rally, if traders continue to believe in the power of the Fed to solve all economic woes with further easing moves, today's data could yet again trigger another bout of short covering.
The Russell 2000 (^RUT) continued to slide and registered its fifth consecutive lower close as it approaches a key support level in the neighborhood of 740. One of the things that I will be watching today is for signs of divergences between the large caps and the small cap index. Should the Russell 2000 be unable to find support near to current levels this would cast a rather long shadow over any upward progress by the larger cap stocks.

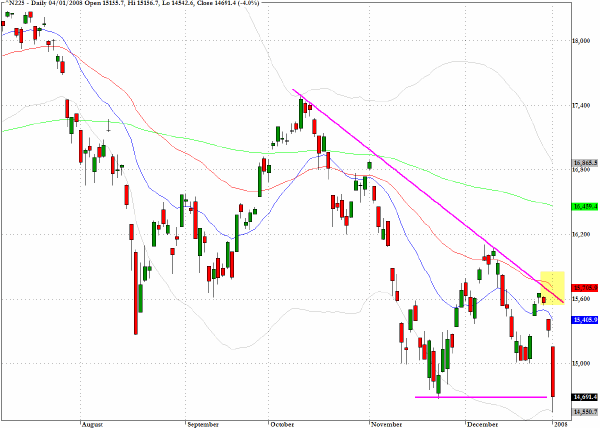
The Nikkei 225 (^N225) re-opened for 2008 after an extended New Year break and sank by more than 4% to its lowest close in almost 18 months. The Bank of Japan which has been following an extraordinarily low interest rate policy for many years, unlike central banks in the US and UK, has no pleasant surprises to offer equity investors, and this index looks set to under-perform again in 2008 as it did in 2007. Especially notable on the chart is the downward trendline I have drawn which should pose a very difficult hurdle in any recovery efforts.
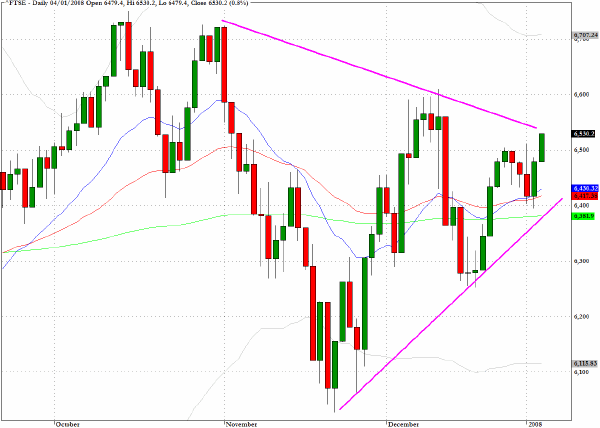
The FTSE index in the UK appears to be ready to test the upper boundary of its triangular trading range pattern. I have included the activity for Friday morning, as this is being written, and the index seems to be surprisingly buoyant considering the pending release of key data in the US later today.
Poor retail activity over Christmas and growing evidence of the plight for many over-stretched consumers is pointing toward an increasing probability of accelerated easing by the Bank of England. To the extent that traders may be right in having confidence that the B of E can reflate the consumer bubble so might traders in the US take comfort today if the employment data is modestly weaker than expected. If it is a lot weaker then the gravitational pull of declining earnings and margin pressures in the corporate sector may prevail.
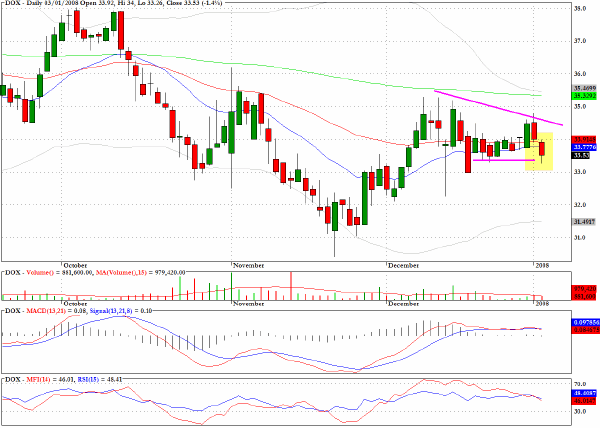
Since failing to break above the 200-day EMA in early December Amdocs (DOX) has been forming a descending wedge pattern.
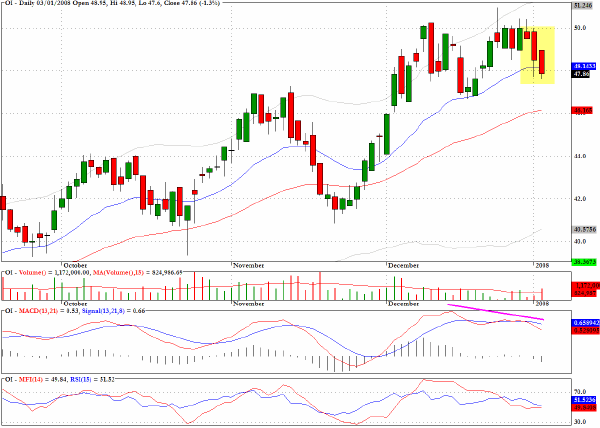
The chart for Owens Illinois (OI) shows how stiff resistance at the $50 level has confined the stock since mid-December. The negative MACD divergence tips me in favor of expecting a move down to the 50-day EMA at least.
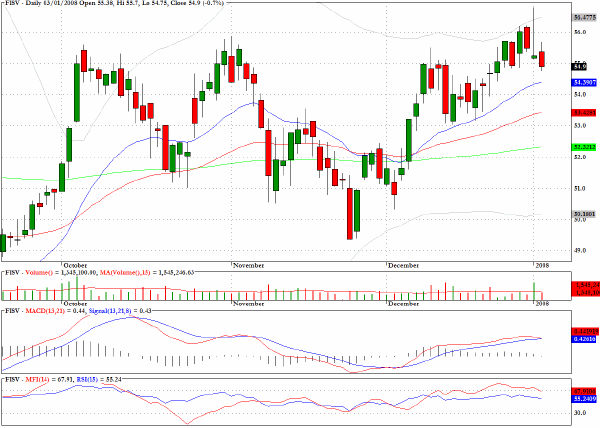
Fiserv (FISV) has an interesting chart pattern that suggests that an attempt to break above $55 is at a make or break stage.
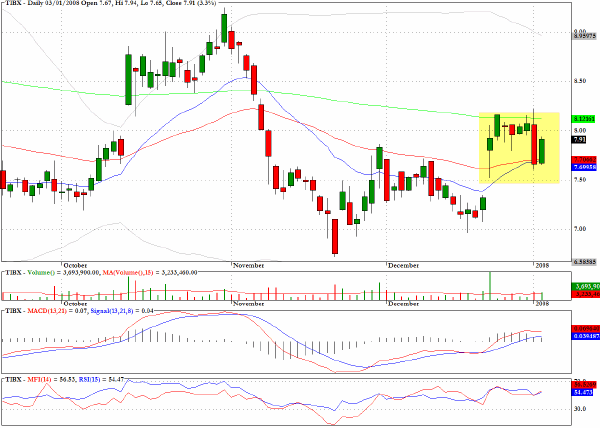
After retreating to the converged shorter term moving averages Tibco Software (TIBX) bounced on above average volume. I would favor a long position based on a continuation move higher but be prepared to take partial profits at the 200-day EMA.
Clive Corcoran is the publisher of TradeWithForm.com, which provides daily analysis and commentary on the US stock market. He specializes in market neutral investing and and is currently working on a book about the benefits of trading with long/short strategies, which is scheduled for publication later this year.
Disclaimer
The purpose of this article is to offer you the chance to review the trading methodology, risk reduction strategies and portfolio construction techniques described at tradewithform.com. There is no guarantee that the trading strategies advocated will be profitable. Moreover, there is a risk that following these strategies will lead to loss of capital. Past results are no guarantee of future results. Trading stocks and CFD's can yield large rewards, but also has large potential risks. Trading with leverage can be especially risky. You should be fully aware of the risks of trading in the capital markets. You are strongly advised not to trade with capital.
|