The weekly chart for the Dow Jones Industrials (^DJI) shows that we are entering an area of probable support, but this support zone is not well defined and has quite wide boundaries that will now need to be tested.
Friday’s data, much weaker than anticipated, is very troubling for the intermediate outlook for US equities. Even the usual cheerleaders and bullish spinmeisters were unable to find a silver lining. The negative divergences and ominous patterns that have been evident for some time finally gave way to the kind of persistent selling that suggest we may finally have broken out of the trading range that contained prices during the second half of 2007.
The weekly chart for the Dow Jones Industrials (^DJI) shows that we are entering an "area" of probable support but this support zone is not well defined and has quite wide boundaries that will now need to be tested.
Although I believe that we are headed lower, I would be careful about getting too enthusiastic on the short side as large bounces can often follow in the wake of the downside action we saw last week. A period of erratic whipsaw action is the most likely scenario in coming sessions as traders explore just where real support kicks in. The intraday of 12455 from mid August seems to be on the radar this week and I would not be surprised to see spikes even further down towards 12000. This is a good market for the intraday trading style but more treacherous for position traders. 
As I discussed on Friday, the tone to the market is often best understood by examining the small and midcap indices rather than focusing exclusively on the more widely followed banner indices. I have included a weekly chart of the S&P 400 Midcap index (^MID) as it shows, once again, that a key support level is nearby but that it also has a series of layers down to the 780 level.
The small caps as reflected in the Russell 2000 (^RUT) index sank by 3.1% and sank below the critical 740 level. There is some minor support near to Friday’s close at 720 but it is highly probable that this index will be testing more fundamental support at the 680 level during this quarter. 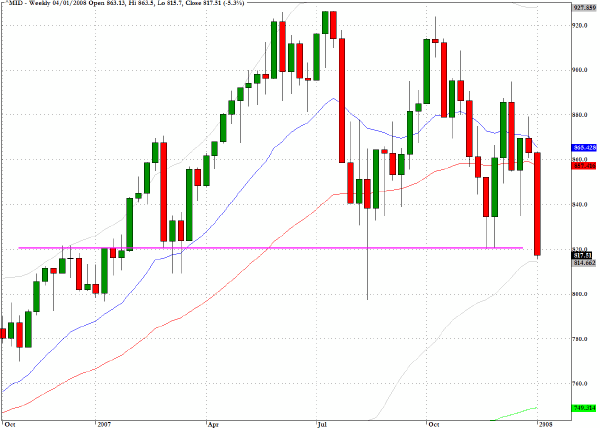
Stepping back to get a longer term perspective on where we’re headed the monthly chart for the retail sector fund, RTH, looks grim. One could quite plausibly make the case, just based on this sector, that the US economy is now embarking on a recessionary path in which we have moved beyond a normal correction and are carving our a new bear market. So is the bull market in US equities that began in 2003 over? Readers may forgive me if I do not answer this question head on but I would suggest that one very useful place to look for clues as to how the question can be answered is in the Treasury market which we should turn to next. 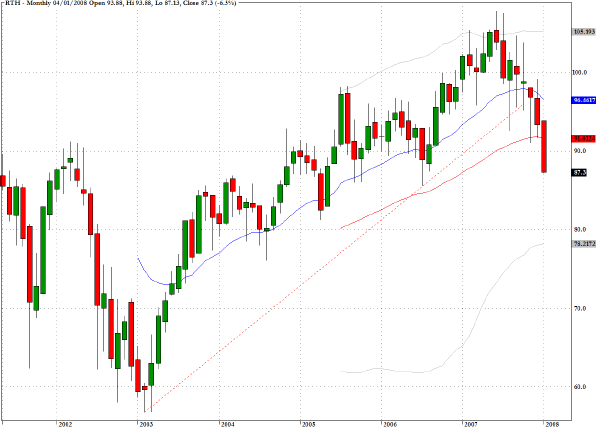
Yields on Treasuries plunged last week but the long term weekly chart below shows that we now have a rather symmetrical and cyclical double top/double bottom pattern to decipher. If we are witnessing the demise of the bull market that began in early 2003 then we should be looking in the weeks ahead for a breakdown in yields towards 3.5% and even lower, as opposed to another cyclical bottoming pattern. 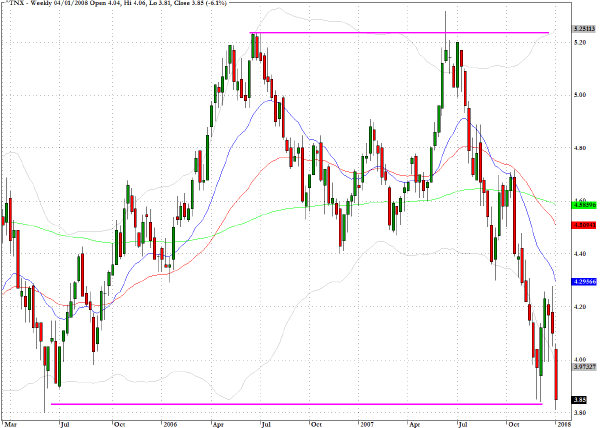
TRADE OPPORTUNITIES/SETUPS FOR MONDAY JANUARY 7, 2008
The patterns identified below should be considered as indicative of eventual price direction in forthcoming trading sessions. None of these setups should be seen as specifically opportune for the current trading session.
Universal Display (PANL) has retreated to a level of potential support/resistance near to $20. 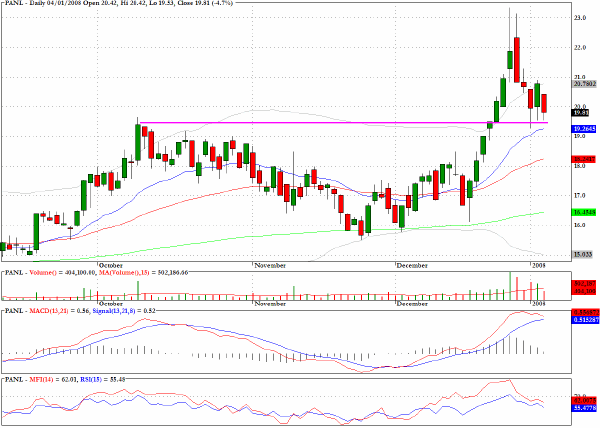
Echelon Corporation (ELON) has a pullback pattern which would allow entry near to all three moving averages. 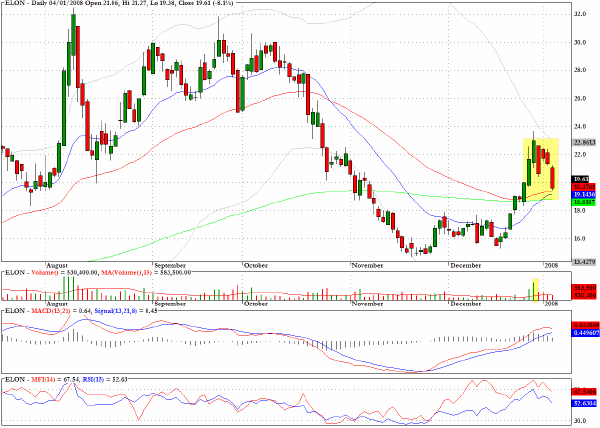
GMarket (GMKT) has an almost orthodox Evening star candlestick pattern which is quite reliably bearish. 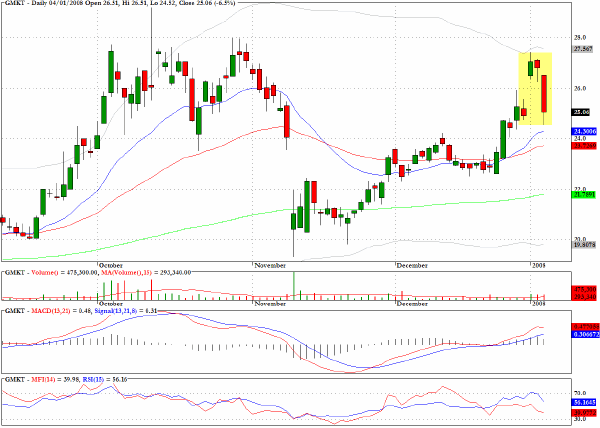
One of the few charts that looks to be in the early stages of a bearish formation, and therefore has more potential for immediate downside action is for Jacobs Engineering (JEC). I would look for a retreat to the 50-day EMA just below $90 as a first target. 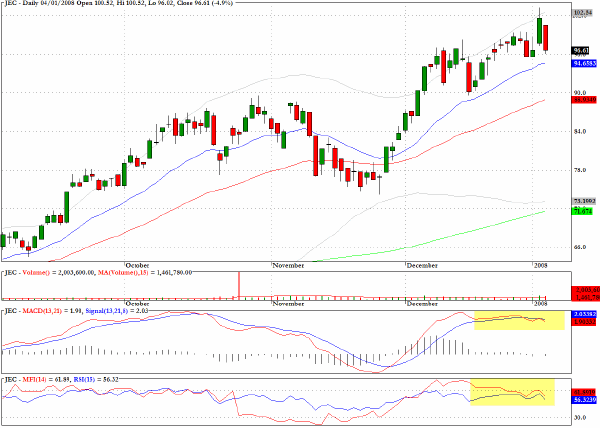
Clive Corcoran is the publisher of TradeWithForm.com, which provides daily analysis and commentary on the US stock market. He specializes in market neutral investing and and is currently working on a book about the benefits of trading with long/short strategies, which is scheduled for publication later this year.
Disclaimer
The purpose of this article is to offer you the chance to review the trading methodology, risk reduction strategies and portfolio construction techniques described at tradewithform.com. There is no guarantee that the trading strategies advocated will be profitable. Moreover, there is a risk that following these strategies will lead to loss of capital. Past results are no guarantee of future results. Trading stocks and CFD's can yield large rewards, but also has large potential risks. Trading with leverage can be especially risky. You should be fully aware of the risks of trading in the capital markets. You are strongly advised not to trade with capital.