| Corcoran Technical Trading Patterns for January 9 |
| By Clive Corcoran |
Published
01/9/2008
|
Stocks
|
Unrated
|
|
|
|
Corcoran Technical Trading Patterns for January 9
The bears were rewarded for being patient in yesterday's session as the early afternoon attempts to try to stabilize failed. Around 2pm New York time the intraday charts gave rise to the notion that we might be on the verge of some respite from the recent selling onslaught, but in the last one and a half hours of trading the selling returned with a vengeance.
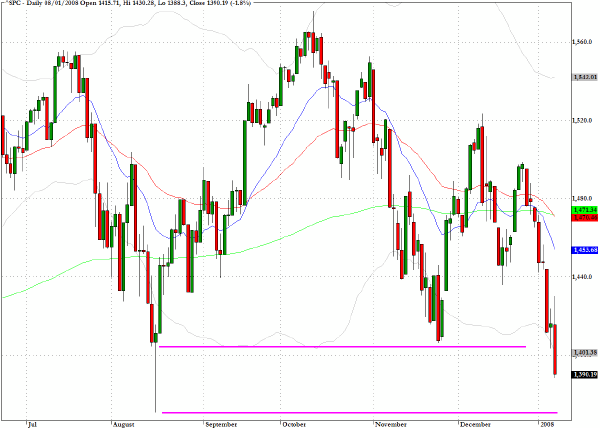
The S&P 500 (^SPC) closed below the mid-August lowest close, but as the chart illustrates, the index is now in a rather treacherous zone where the mid-August intraday low would seem to be a probable target for testing. As I suggested on Monday, I would not be surprised to see us thrashing around in this zone while aggressively bearish traders stay on the lookout for any signs of meaningful bids coming into the market.
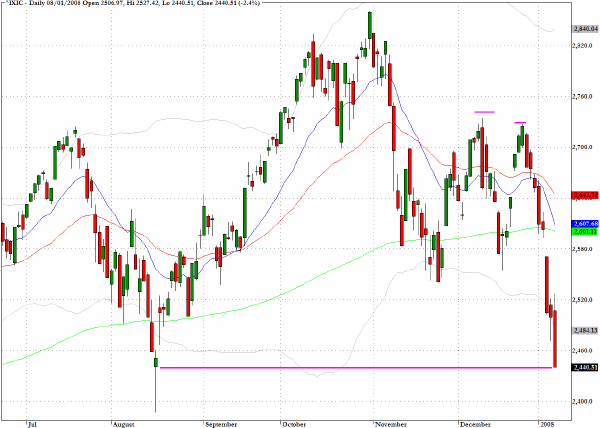
Similar reasoning can be applied to the Nasdaq Composite (^IXIC) which is now more than 400 points, or fifteen percent, below its multi-year high close of 2859 achieved on October 31 last year. Reviewing the longer term charts, there is meaningful chart support in the 2340 region if we take out the intraday low of 2386 from August 16.
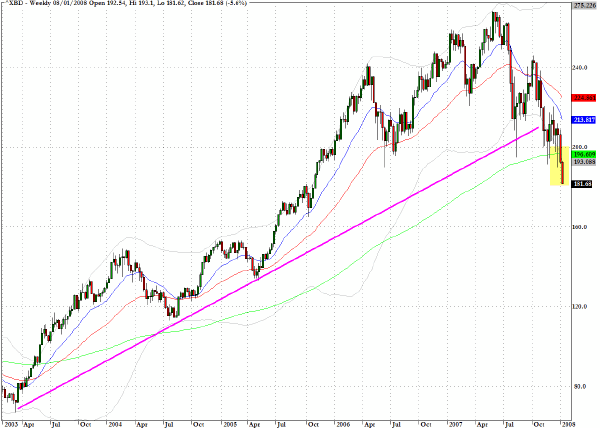
Readers may recall how frequently I used to feature the chart of the broker/dealer sector (^XBD) in the summer and fall of 2007 as the calamities with structured financial products became mainstream news. Having not reviewed the sector in the Daily Form commentary for some time, it seemed worthwhile to step back and take a longer term view of where we currently stand.
The weekly chart extends back to early 2003 where the bull market was born, and as with some of the other sector charts in the financial area and consumer facing sectors, the simplest view is that the bullish market dynamics that have prevailed for almost five years are now broken. To be added to the obvious drop below the trendline is the fact that the sector index has now broken below the 200-week EMA. Most concerning is the absence of any obvious chart support until we reach down almost another twenty percent towards the 150 area. I am not suggesting that we are going to that level in a hurry, but we are now in territory where chart diagnostics cannot be very reliable.
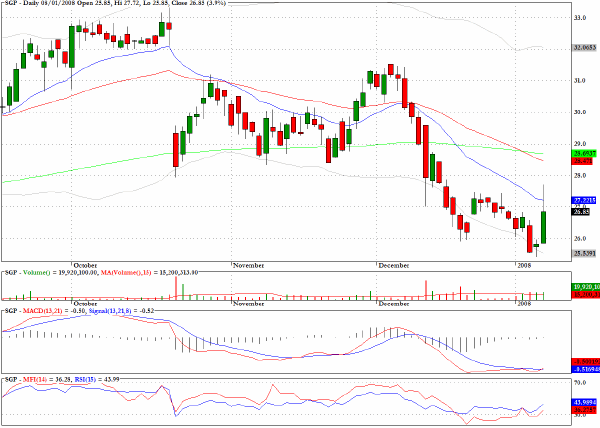
Schering Plough (SGP) defied the market yesterday to produce one of the few genuinely bullish looking charts in the immediate term.
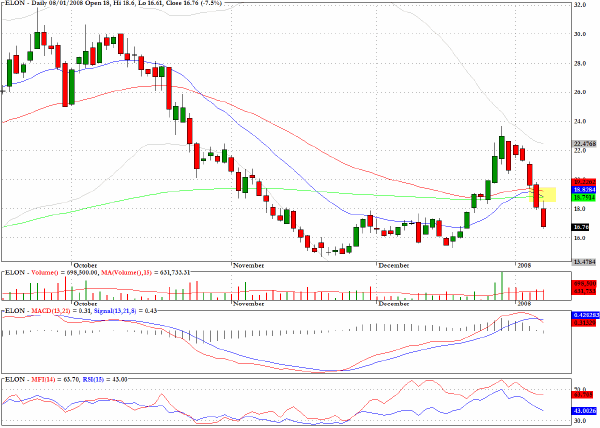
As follow up to a couple of recent charts that I have featured, Echelon Corporation (ELON) failed to take any notice as it approached the possible support of all three moving averages and rewarded the bears and not the bulls as I had intimated.
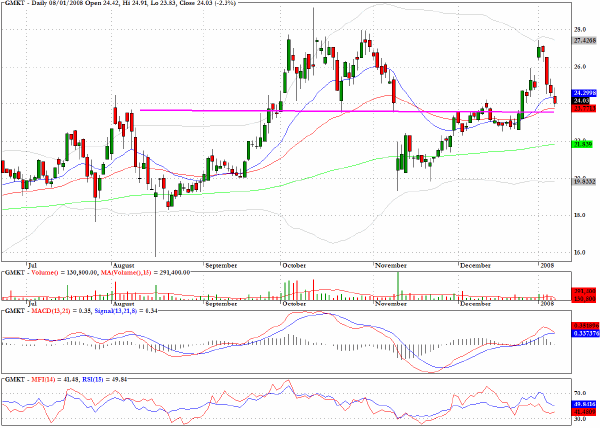
In Monday's column I cited GMarket (GMKT) which was revealing an Evening star candlestick pattern and the slide continued, but the stock has now reached a level where I would cover shorts and where a bounce might be expected.
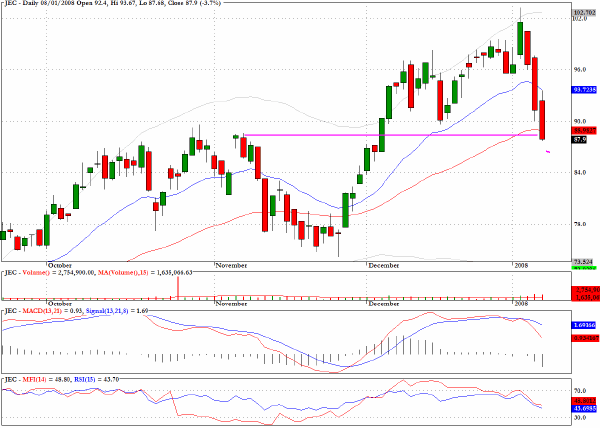
Also in Monday's column I suggested that "One of the few charts that looks to be in the early stages of a bearish formation, and therefore has more potential for immediate downside action is for Jacobs Engineering (JEC). I would be looking for a retreat to the 50-day EMA just below $90 as a first target."
Selling Monday's open and covering at the end of yesterday's session would have produced an almost ten percent gain and more or less in line with the specified target.
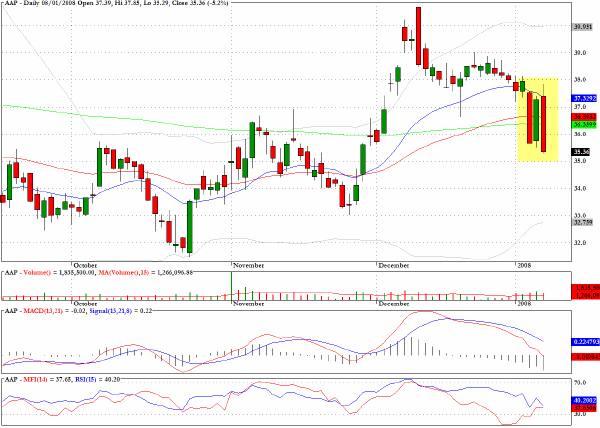
As if to highlight how hard this market is to trade for a position trader, the chart for Advanced Auto Parts (AAP) shows three consecutive abrupt reversals. As with many other sloppy patterns, this is keeping me quite cautious at present.
Clive Corcoran is the publisher of TradeWithForm.com, which provides daily analysis and commentary on the US stock market. He specializes in market neutral investing and and is currently working on a book about the benefits of trading with long/short strategies, which is scheduled for publication later this year.
Disclaimer
The purpose of this article is to offer you the chance to review the trading methodology, risk reduction strategies and portfolio construction techniques described at tradewithform.com. There is no guarantee that the trading strategies advocated will be profitable. Moreover, there is a risk that following these strategies will lead to loss of capital. Past results are no guarantee of future results. Trading stocks and CFD's can yield large rewards, but also has large potential risks. Trading with leverage can be especially risky. You should be fully aware of the risks of trading in the capital markets. You are strongly advised not to trade with capital.
|