| Weekly Outlook in the Stock Market |
| By Price Headley |
Published
01/14/2008
|
Stocks
|
Unrated
|
|
|
|
Weekly Outlook in the Stock Market
NASDAQ Composite
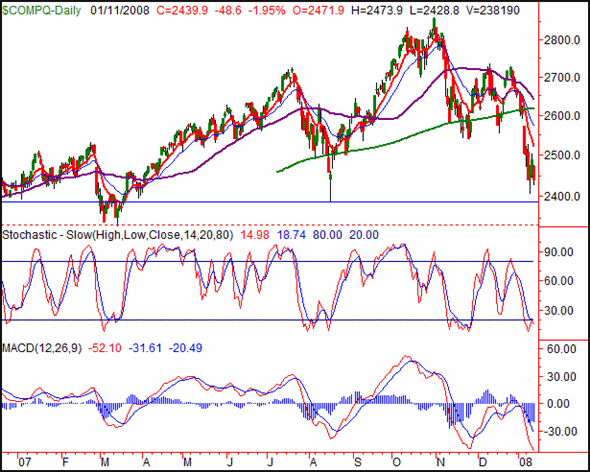
The NASDAQ was Friday's biggest loser (barely) falling by 48.6 points, or -1.95%. For the week the composite lost 64.8 points, or 2.59%, easily the biggest loss of the three major indices. As of right now the index, or the market for that matter, is pointed in the right direction. However, the sizable loss may have set up a big bounce, acting as a washout/capitulation week. There's one make-or-break level nearby that will help us make that call.
Remember the number 2386.7, at least for the next few days. That was August's low, and it looks like the sellers were trying to get the index back to that line again; last week's low was 2407 (solid, blue). If we get to that low and make a pause, it may be time to buy in. If instead we get to that low and keep going lower, well, things may be going from bad to worse. Last March's low of 2331 (red, dashed) is coming into view as well, and if that level falls then we're really in trouble. (Note that the S&P 500's line in the sand is more important than this one, as it's been touched and validated twice. See below.)
That said, the NASDAQ's stochastic chart says it's fully oversold now, surprisingly for the first time since late November. That may be enough to inspire a rebound, which would be greatly welcomed by most. However, we have no true evidence we're there yet. As we've been examining in recent TrendWatches though, we sure have some signs that we're at a bottom - the market doesn't have much more to give up.
NASDAQ Composite - Daily

S&P 500
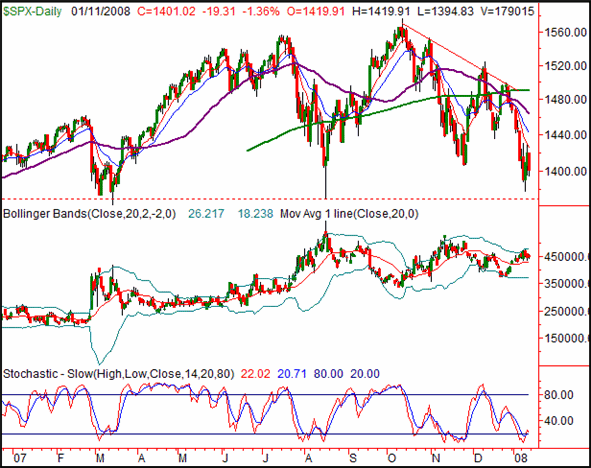
The S&P 500 fell 19.31 points (-1.36%) on Friday, ending the session at 1401.02. For the week, that led to a loss of 10.61 points (-0.75%). The net result of another loss is simple; the SPX is now fully oversold, and ripe for a rebound (as we've seen the last few times we've been this oversold). The question is, will we actually get it?
Burn this number into your head: 1370 (dashed). That's where the S&P 500 hit a low in August, and basically where it bottomed in March. Last week's low of 1378 was close as well, and we're now within striking distance of that line again. Traders may well want to see that level brushed one final time before jump-starting any recovery effort (which we're certainly due for).
Lending itself to the bullish argument is the VIX. After running into its upper Bollinger band last week, we started to see it peek back from it. To see that happen at the same time we're so oversold? It just looks like a compelling possibility.
That said, we have no evidence from the chart whatsoever that a bounce is brewing up....just a ton of signs that say a bottom has been made.
S&P 500 - Daily

Dow Jones Industrial Average
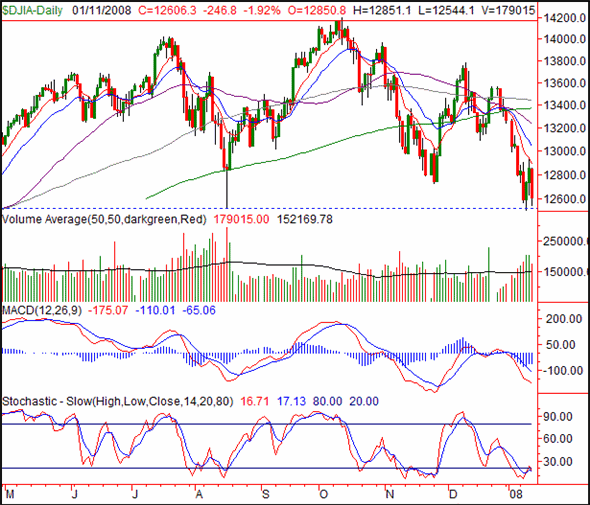
The Dow's close of 12,606.3 on Friday was 146.8 points (-1.92%) below Thursday's close. That led to a weekly close in the red, by 193.9 points (-1.51%). Like the S&P 500, the Dow is certainly ripe for a bounce, On the other hand, it seems to be struggling with even getting over the 10-day moving average line.
The Dow's line to watch is 12,517 (dashed), August's low, and basically last week's low. Other than that, the story is basically the same here as it was for the other two indices above.
Dow Jones Industrial Average - Daily

Long-Term Chart
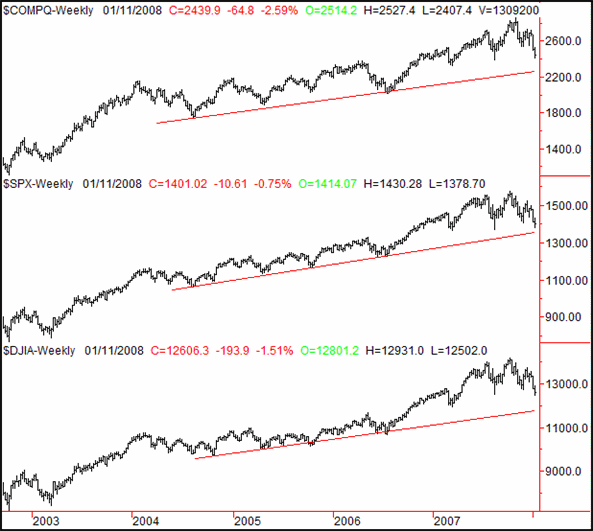
Two things stick out about the weekly charts of all three indices. First, none of them yet seem to be at their long-term support lines, not that they necessarily need to be to start a new rally. Second, all three seem to be a little head-and-shoulderish over the last several weeks.
Just for the record, the NASDAQ's, S&P 500's, and the Dow's long-term support lines (red) are respectively at 2262, 1354, and 11,776.
Long-Term Index Charts - Weekly

Price Headley is the founder and chief analyst of BigTrends.com.
|