| Big Caps Continue to Outperform Small |
| By Mike Paulenoff |
Published
01/14/2008
|
Futures , Stocks
|
Unrated
|
|
|
|
Big Caps Continue to Outperform Small
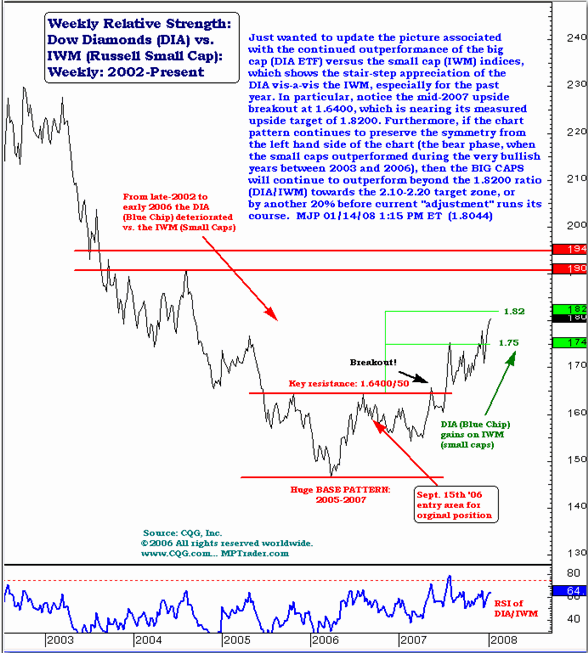
One glaring move that is occurring below the radar screen is in Dow Diamonds (AMEX: DIA)/ iShares Russell 2000 ETF (AMEX: IWM) ratio chart, which shows the outperformance of the big caps at the expense of the small caps, using the Dow Diamond ETF and the Russell 2000 ETF, especially for the past year. In particular, notice the mid-2007 upside breakout at 1.6400, which is nearing its measured upside target of 1.8200. Furthermore, if the chart pattern continues to preserve the symmetry from the left hand side of the chart (the bear phase, when the small caps outperformed during the very bullish years between 2003 and 2006), then the big caps will continue to outperform beyond the 1.8200 ratio (DIA/IWM) towards the 2.10-2.20 target zone, or by another 20% before current "adjustment" runs its course.

Mike Paulenoff is a 26-year veteran of the financial markets and author of MPTrader.com, a real-time diary of his technical chart analysis and trading alerts on all major markets. For more of Mike Paulenoff, sign up for a free 15-Day trial to his MPTrader Diary by clicking here.
|