| Corcoran Technical Trading Patterns for January 16 |
| By Clive Corcoran |
Published
01/16/2008
|
Stocks
|
Unrated
|
|
|
|
Corcoran Technical Trading Patterns for January 16
Citigroup's historic Q4 loss, collateral write-down and dividend cut went down like a lead balloon in yesterday's session and to mix metaphors the news really took the wind out of the sails of those who sensed that the really bad news on the CDO mess was already priced into the market. Citigroup shares have been cut in half in the last year and there is clearly further troubles ahead as other banks are lining up to announce yet further write-offs. The sub-prime crisis is cited as the principal cause but lurking beneath the surface is the more troublesome issue of the difficulty of transparently pricing the trillions of dollars worth of structured products that allowed for the almost limitless notional capital that banks and other financial intermediaries were eagerly putting to work in the mortgage market and private equity arena until just a few months ago.
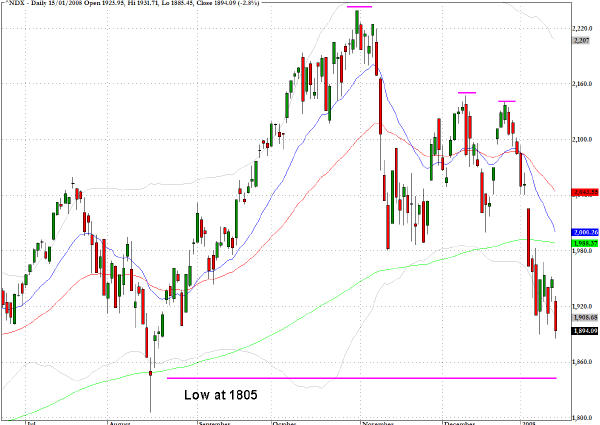
As if yesterday's drubbing wasn't enough, after the bell Intel (INTC) gave the market more bad news and the Nasdaq Composite (^NDX) looks set to test the intraday low of 1805 from August 16th. The one possible redeeming factor is that there are a lot of zealous shorts that seem to have already begun the countdown to the Apocalypse. But if there is a financial Armageddon ahead this is unlikely to show up exactly on cue.
I shall be the guest analyst on CNBC's European Closing Bell this afternoon and will air my views on some slightly alarming intermediate-term targets for several global indices. These are all plausible from a technician's perspective in the next few months, but in the shorter term we have to take into account the possibility that the markets will snap back rapidly when Chairman Bernanke rides to the rescue with, at a minimum now, a fifty basis point cut in the fed funds rate.
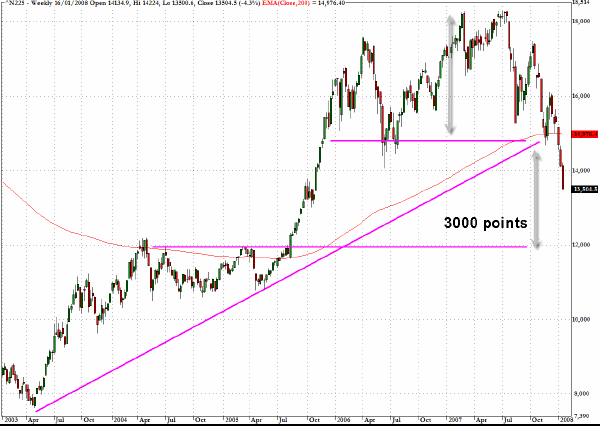
Asian markets got whacked in overnight trading with the Hang Seng Index (^HSI) dropping by more than five percent and the Nikkei 225 (^N225) continuing the slide we discussed in yesterday's commentary and falling another three and one half percent. The chart below which I shall discuss on CNBC Europe this afternoon shows that a technically feasible target for this index is 12000. It appears that we are already into the process of giving back the three thousand points from the neckline to the top of the head. The fact that the neckline and the 200 week EMA (marked in red on the chart) coincide at the 1500 level and that we have broken decisively below both levels gives increasing plausibility to this scenario.
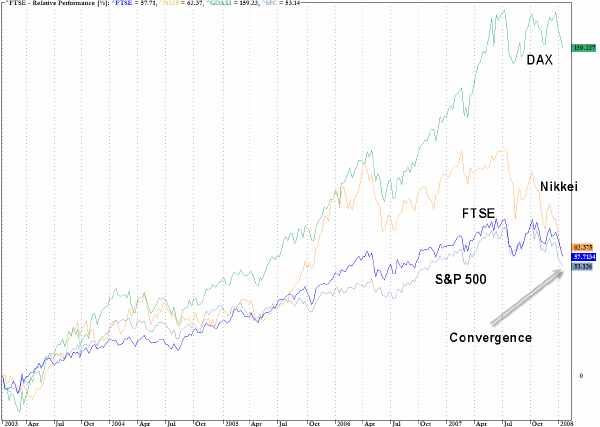
Relative performance charts are often quite revealing especially when a critical date is chosen for the base period. If we track the progress of the S&P 500, FTSE, Nikkei 225 and the German Dax index back to early 2003 when the bull market began we can see that, while very different trajectories were followed over the last five years, in the last few weeks the flagship indices of the US, UK and Japan have converged remarkably.
What is also very striking is the out-performance of Germany’s Dax. Whether this index will now begin to play catch-up on the downside or in contrast, because it has been less tainted by the bubble mentality of the Anglo-Saxon markets and the extended hangover of the financial mania that beset Japan in the 80’s, it will suffer less in what lies ahead, remains to be seen.
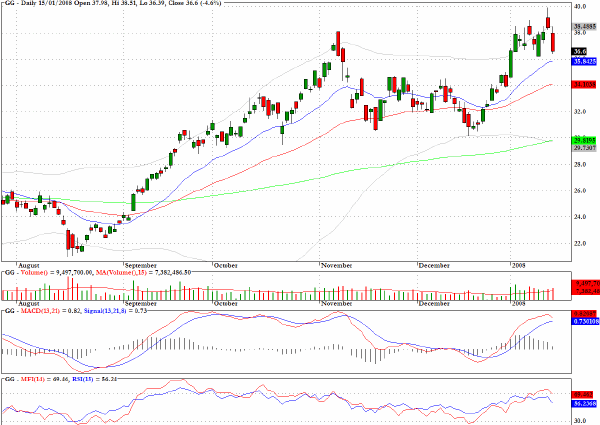
Goldcorp (GG) suffered in the selloff that hit gold and mining stocks yesterday but I would be looking at the long side in coming sessions.
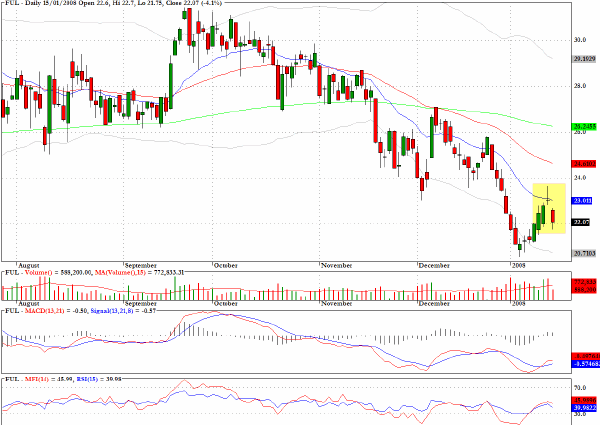
Fuller (FUL) has an evening star formation which I have found to be quite reliably a bearish indicator.
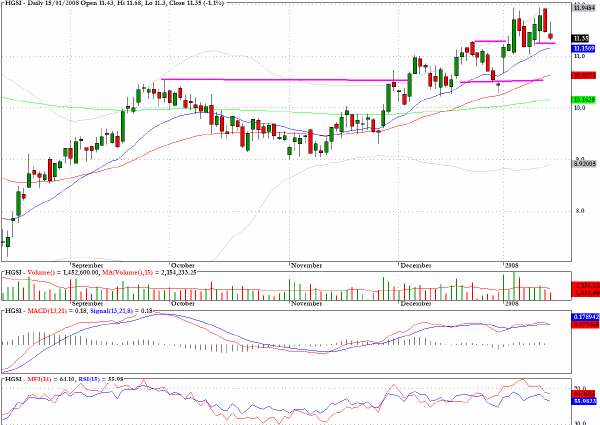
Human Genome Sciences (HGSI) was a very profitable long trade for us in late December and there are two layers of potential buying support below yesterday's close and I would be looking, not impatiently, to get long during the course of the pullback.
Clive Corcoran is the publisher of TradeWithForm.com, which provides daily analysis and commentary on the US stock market. He specializes in market neutral investing and and is currently working on a book about the benefits of trading with long/short strategies, which is scheduled for publication later this year.
Disclaimer
The purpose of this article is to offer you the chance to review the trading methodology, risk reduction strategies and portfolio construction techniques described at tradewithform.com. There is no guarantee that the trading strategies advocated will be profitable. Moreover, there is a risk that following these strategies will lead to loss of capital. Past results are no guarantee of future results. Trading stocks and CFD's can yield large rewards, but also has large potential risks. Trading with leverage can be especially risky. You should be fully aware of the risks of trading in the capital markets. You are strongly advised not to trade with capital.
|