| A Mid-Week Look at the Market |
| By Price Headley |
Published
01/17/2008
|
Stocks
|
Unrated
|
|
|
|
A Mid-Week Look at the Market
NASDAQ Composite
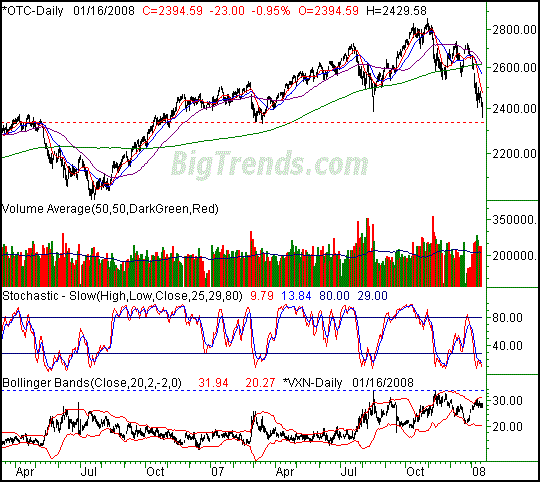
The NASDAQ Composite took it on the chin Wednesday, losing 23 points (-0.95%) to end the day at 2394.59. On a weekly basis, we're now 45.35 points under Friday's close (-1.86%). Things have gotten to the 'painful' stage.
However, there should be an important footnote added to the NASDAQ's dismal performance...it was all from the computer-related stocks. The NASDAQ's financial components actually ended the day much higher. So, don't take the loss to heart. (The Dow had a similar oddity, as you'll read below.)
We really zoomed out on today's NASDAQ chart, mostly to offer some perspective. We've got two years worth of trading to show, which includes the dip from May/June of 2006. There are a lot of stark parallels between then and now.
As reminded, the NASDAQ fell (from peak to low) by15.8% in 2006, and it's fallen (from peak to low) by 17.4% in 2007/2008. The 2006 dip took about three months to complete; the NASDAQ has been selling off for about the last three months. In 2006, the NASDAQ fell 9.6% under the 200 day moving average line (green). As of today's low, the composite has been as much as 9.8% under the same 200-day line.
We're not saying this is a repeat of 2006 (which by the way set up a monster rally), as the economic backdrop was different. We're just saying to rule nothing out, and reminding you that things can look darkest before dawn. As of right now stocks are more of a liability than an asset. If they turn up for a few days though, we won't be a bit afraid to buy in.
On the flipside, if 2340 breaks, caution is advised; we'll be more bearish then. The NASDAQ's head-and-shoulders pattern is still nagging us.
NASDAQ Composite - Daily

S&P 500
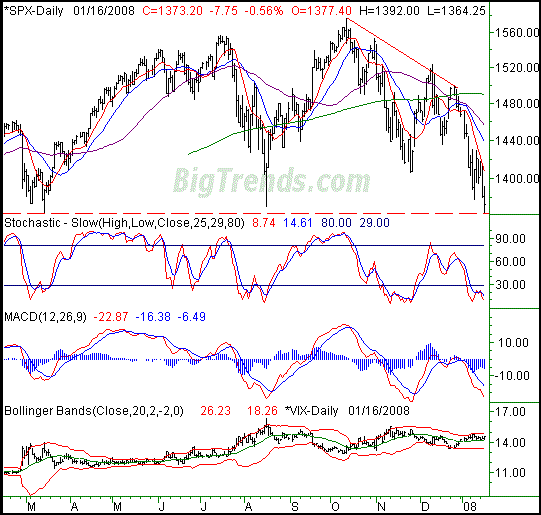
Wednesday's loss of 7.75 points for the SPX (-0.56%) pulled the index to a close of 1373.20. For the week so far it's underwater by 27.80 points, or 1.98%; it's the week's biggest loser at the mid-way point. However, the S&P 500 is also the only index that has some specific hope that the worst is over.
Take a look at the red, dashed line on the chart below. Wednesday's low of 1364.25 is basically the same as the March 14 low of 1364, and pretty darn close to the August low of 1370.60. Though the momentum is just plain bearish, it was in March and August as well.
In short, 1364 is the make-or-break point.
S&P 500 - Daily

Dow Jones Industrials
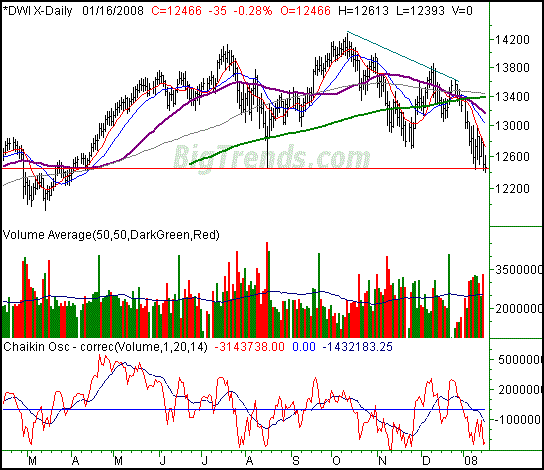
The Dow Jones Industrial Average fell by 34.95 points on Wednesday, a 0.28% slide that left it at 12,466.16. For the week, we're in the hole by 140 points, or 1.11%, and still pointed lower.
Curiously, the transportation average saw a healthy gain of 31.61 points, or 0.75%. The fact that the transportation stocks rose on Wednesday - as well as for the past few days - is one of the key reasons we think the broad market's weakness isn't an omen of even worse things to come. It hasn't been pretty, but corrections happen.
In any case, the Dow's limits are being tested. The August low, much like the S&P 500's, is pretty much where the Dow's trying to find a floor now. (See the solid red line.) Wednesday's low of 12,393 is a little bit under the August low of 12,456, but that's close enough for us to say there's some significance to that line. If it breaks, then we could be in big trouble.
Dow Jones Industrials - Daily

Price Headley is the founder and chief analyst of BigTrends.com.
|