| The McMillan Options Strategist Weekly |
| By Lawrence G. McMillan |
Published
01/18/2008
|
Options
|
Unrated
|
|
|
|
The McMillan Options Strategist Weekly
Even for those of us who have been bearish, the nastiness of this bear is a little startling. I used to think Arthur Burns was the most bearish Fed Chairman ever (every time he spoke in 1973-1974, the market went down), but Ben Bernanke has nearly ascended that dubious throne.
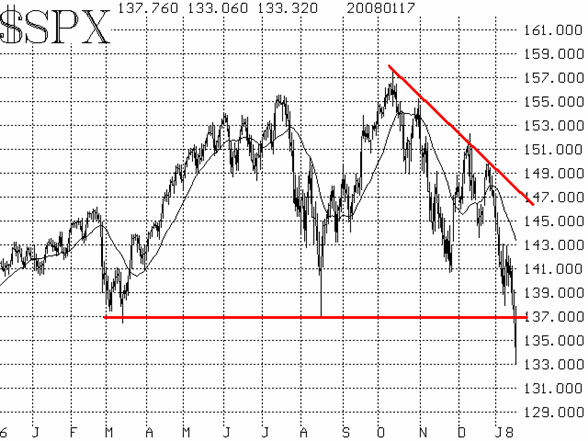
A week ago, $SPX bounced off an intraday low at 1380 and actually rallied 50 points (does anyone even remember?), but this week that level was tested again -- and broken, as $SPX traded down to 1365 on Wednesday. This was an important level, because it was roughly equal to the March and August lows. Bulls were hoping that a triple bottom could form on the chart. However, as we noted in our Daily Volume Alerts report: "Given the fact that this market is technically damaged, and that many other indices (such as the Russell 2000) have already exceeded previous lows, we would not bank on the fact that 1365 will provide any sort of permanent support." It didn't provide support -- not even for a day -- as $SPX plunged through that support, trading all the way down to 1330 today. This breakdown in $SPX matches many, many stock charts that we have seen over the past few weeks. As I've been saying, this is the worst group of stock charts that I can ever remember seeing. And now $SPX belongs in that group as well. When a chart shows this type of breakdown below multiple support levels (1365), it can generally be sold on rallies back towards that level, which now represents resistance.

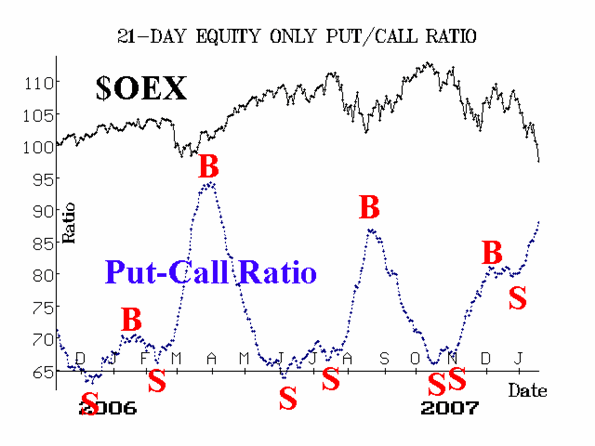
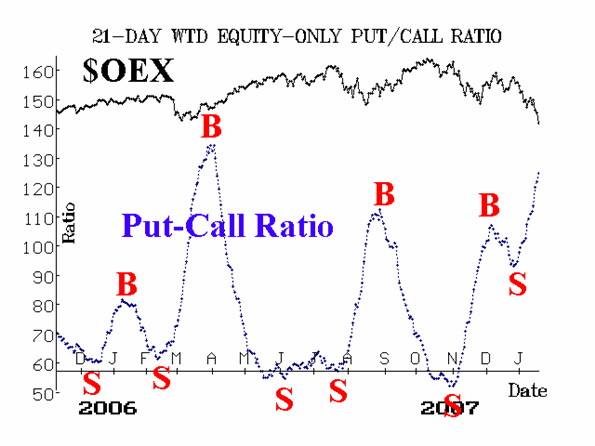
Equity-only put-call ratios have blasted to the upside this week, as massive put buying is finally taking place. They are reaching the higher regions of their respective charts, meaning they are "oversold." However, they will not give buy signals until they roll over and begin to head downward. That doesn't seem likely to happen quickly.

Market breadth (advances minus declines) gave a sell signal on December 27 and hasn't given a buy signal yet. It is also extremely oversold, which means that a sharp, but short-lived rally is possible at any time. However, a true buy signal would take several days of positive breadth to construct.

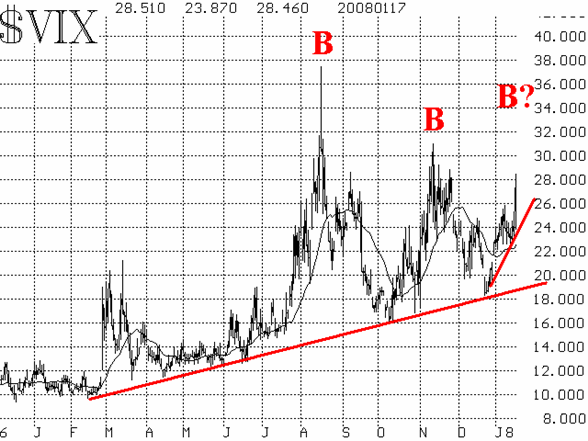
The last technical indicator that we routinely follow is volatility. $VIX had only been edging upward, even though the market was taking a beating. That was true even up through Tuesday of this week. $VIX usually makes a spike peak when the market collapses, but that wasn't happening. Yes, the market was collapsing, but $VIX was only in a slow uptrend. Some attributed the lack of upward movement in $VIX to hedging strategies, but in reality it was most likely due to the fact that people were still complacently bullish. However, in the last two days, things have changed greatly. $VIX finally exploded, with today's breakdown below that triple support level. $VIX exploded four points to the upside (to 28) and $VXO five points (to 32).

In summary, the overall trend is bearish. This is at least as nasty a market as July 2002 was, and even though a bottom was eventually recorded that month, it was retested in October 2002, and again in March 2003. The point is that, with this much damage having been done, this market is not going to just reverse and start a new bull phase. Yes, there could be a powerful oversold rally, but it won't last.
Lawrence G. McMillan is the author of two best selling books on options, including Options as a Strategic Investment, recognized as essential resources for any serious option trader's library.
|