| Messy Bureau of Labor Statistics Data |
| By John Mauldin |
Published
01/19/2008
|
Stocks , Options , Futures , Currency
|
Unrated
|
|
|
|
Messy Bureau of Labor Statistics Data
After a wild week in the markets, there is so much to write about, it is hard to know where to start. The headline number says jobless claims fell 20,000. That would be good news, if it were true. Sometimes you need to look behind the curtain to see how these statistics are made. As we will see, claims were actually up by 26,000. I wrote in my annual 2008 predictions that the big story of the year would turn out to be credit default swaps and counter-party risk. I will admit to thinking it would take more than a few weeks for that to happen. And the Senate is hampering the ability of the Fed to work, and doing so for blatant political purposes, in an effort to reduce the independence of the Fed. There is that and a lot more to cover in what should be an interesting letter.
Messy Bureau of Labor Statistics Data
The Bureau of Labor Statistics (BLS) reported that jobless claims dropped a significant 21,000 in the last week to 310,000 and down by 56,000 in the last four weeks. As a Bear Stearns analyst wrote: "Although claims are volatile early in the year, and in recent years have been prone to upward revision, the magnitude of the decline in initial jobless claims in the first two weeks of the year suggests that job creation did not deteriorate further in January."
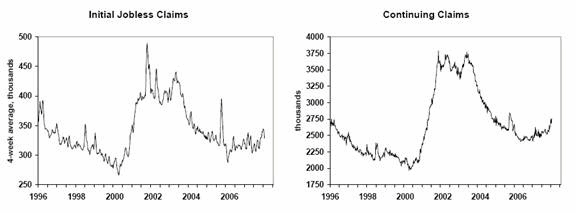
However, this claims data does not square with the employment numbers which came out last week and showed a significantly weaker jobs picture. Note that continuing claims is in a decided rising pattern, while initial claims seem to have turned back down.

So what gives? It seems that BLS statistics, like making sausage, is a very messy process. The key factor here is that the number (301,000) is seasonally adjusted. This means the BLS smoothes the data on an annualized basis, which makes the number less volatile from week to week. And as you might guess, that process of seasonally adjusting looks at prior data points and projects future trends
This of course leads to large revisions at turning points. For example, the BLS is now indicating it expects to revise the year ending in March of 2007 downward by some 300,000 jobs. And you can expect further downward revisions as time goes on.
But let's return to the initial claims data. Every week I get an analysis of the claims data from long-time reader John Vogel. Mostly it is not very exciting, but he does a very thorough job of examining the actual data and comparing it to previous years. Stick with me here as I run through a few numbers.
Last week there were actually 521,280 initial claims. That number rose to 547,637 this week. So why didn't the seasonally adjusted number rise? Because in week three of previous years the number dropped, often considerably. In 2007 the number was essentially flat. But in 2006, the drop in the third week was 116,000 and in 2005 it was 226,000. There were also big drops in 2004 and 2003, 187,000 and 172,000 respectively.
So, when you smooth the number out by making seasonal adjustments, you expect a large drop in week three from week two. Except that we did not get that drop, we got a rise of 26,000, which is clearly not the trend for the last five years. That also squares with last week's employment survey which shows job weakness.
So, why use the seasonally adjusted number? Because the actual number is very volatile. Last week's number was considerably lower than the years of 2003-5, by an average of 175,000 or so. That would be considered good, yes?
But this week's number is the highest since 2002. That would be considered bad, of course. What it really means is that the BLS numbers should be taken with a huge grain of salt around periods when the economy is changing, as it is now. And using them to make a case that the economy is not weakening, as a number of pundits did, could be considered misleading. But now, gentle reader, if that did not put you to sleep, you know more than most pundits.
Let me make a quick point. The staff at the BLS does a very good job in a very difficult environment. As time goes on, they revise their statistics into something that is accurate and useful. But to use the data as it is initially reported to make investment decisions is not a wise thing. The data is not intended for that purpose.
Credit Default Swaps: The Continuing Crisis
As noted above, I said three weeks ago that the big story for 2008 would be the counter-party risk for credit default swaps. That story is coming faster and larger than I thought. Bill Gross of Pimco suggests that the ultimate cost could be another $250 billion dollars on top of the $250-plus billion in subprime losses. That means we have only seen the tip of the iceberg in write-offs in the financial sector.
The real problem is the "monoline insurers" like ACA, Ambac, and MBIA. Here's a quick primer on how they work. Let's say you are a small municipality and want to borrow $10,000,000 for a bond offering to build a road or a water treatment plant. If you went to the market with your credit rating, it would be a low rating and the cost of the money would be high. But if you get one of the seven monoline insurers to guarantee your bond, then you get whatever their credit rating is. The fees for such insurance are lower than the savings you get on the bond, so everyone wins.
But over the years, most of the monocline insurers went from boring municipal bonds and jumped into the mortgage-backed security markets, selling credit default swaps that significantly juiced up their earnings. But it also added a lot of risk that they clearly, in hindsight, did not understand.
ACA has already seen its rating go from A to CCC, which is basically junk. This puts it out of business, as no one will pay to be rated as junk. ACA now has only $425 million in capital to cover the $69 billion in mortgage and corporate bonds they insure. Interestingly, they added $20 billion of that between April and September of last year. Talk about doubling down on a losing trade. Merrill wrote down almost $2 billion in bonds that were insured by ACA. They will not be alone.
Today, Fitch downgraded Ambac Financial Group two notches from AAA to AA. That doesn't seem like a lot, until you realize that 74% of their revenue comes from that AAA rating that covers $556 billion in municipal and structured finance debt. Fitch did so because Ambac decided not to do an equity offering for $1 billion to stem the bleeding. Six months ago Ambac was at $96 or thereabouts. Today it is as $6.20. Its market cap is only $629 million, so a $1 billion offering would dilute current shareholders by around 70%. Ouch. And you can bet any offering they do now will be on terms that shareholders will not like, most likely a convertible offering that dilutes current shareholders even more.
Oh, and that means that 137,990 municipalities that were insured by Ambac will see their credit ratings drop and their costs rise. Think their customers will hang around?
Moody's says it is going to review MBIA. MBIA, which is rated AAA, raised $1 billion last week from Warburg Pincus and did another offering for surplus notes for $1 billion at 14%. As Michael Lewitt noted, that means 14% is the new price for AAA bonds. Except that today it is 23%. If you bought that note, you are not looking good right now. They are trading at 70 cents on the dollar. Of course, that is better than Ambac's 30-year bonds, which are trading at 35 cents on the dollar.
When Warren Buffett bought Gen Re, the large re-insurer, five years ago, he presciently made the decision to reduce their exposure to credit default swaps. It took them four years to reduce the number of contracts from 23,218 to just 197 at the end of 2006.
"We lost over $400 million on contracts that were supposedly 'safe and properly priced' and we did it in a leisurely way in a benign market," says Mr. Buffett. "If we had to unwind it today in one month, who knows what would have happened?" (The Wall Street Journal)
If you are a bank or regulated entity, and you have mortgage-backed securities that have been written by a AAA monocline company, you can carry that debt on your books as AAA. But as the companies get downgraded, you have to write down the potential loss. Quoting from a recent note from Michael Lewitt:
"MBIA's total exposure to bonds backed by mortgages and CDOs was disclosed to be $30.6 billion, including $8.14 billion of holdings of CDO-squareds (CDOs that own other CDOs, or mortgages piled on top of mortgages, or, to quote Jeff Goldblum's character in Jurassic Park again, 'a big pile of s&*^'). MBIA was being priced as a weak CCC-rated credit when it issued its bonds last week; it is now being priced for a bankruptcy. MBIA's stock, which traded just under $68 per share last October, dropped another $3.50 this morning to under $10.00 per share.
"The bond insurers' business model is irreparably broken. In HCM's view, it will be all but impossible for these companies to raise capital at economic levels for the foreseeable future and certainly in enough time to work out of their current difficulties. The performance of MBIA's 14 percent bond issue will prove to have been the death knell for this business. The market needs to come to the realization that the so-called insurance that these companies were offering is not going to be there if it is needed. The fact that these companies were rated AAA in the first place will remain one of the great puzzles of modern finance for years to come."
You can bet that the $8 billion in CDO-squareds is gone. It is a matter of time. MBIA's market cap is about $1 billion. Current shareholders will be lucky if they only get diluted 75%.
Watch Warren Buffett swoop in and take that boring old municipal bond insurance business. Watch a few large hedge funds buy the remains of the monoline carriers to get their staff and experience (especially the municipal sales teams), and launch new companies with pristine credit.
If you have Ambac or MBIA insurance, as a bank you have not yet written down any debt they insured. They are still rated AAA. But that re-rating is coming. And what about the monster CDS business in the hedge fund world? Who wins and loses? There will be huge winners, and there will be total wipe-outs. There are going to be more losses in the biggest banks, and even bigger investments by Sovereign Wealth Funds. Count on it. This is a story we will return to time and time again.
A Stimulating Political Package
Today President Bush proposed a $150 billion package to stimulate the economy. There is no telling what the final package will look like. Bush is seeking something rather simple and direct, but proposals for all sorts of complicated goodies started to immediately surface, some of which is clearly not stimulus but political opportunism.
Just a few thoughts. $150 billion is about 1% of total GDP, so the hope would be that you get a 1% boost in GDP. But that is not reality. In 2001, Bush and Congress instituted a huge stimulus program, sending out billions. Academic studies found that most of the money went into savings, which is hardly a stimulus.
Further, we are in far worse credit shape now than then. How much of the $150 billion would be spent to pay down credit card debt? That would be a good thing, except that it's not stimulus. And it looks like the payments will come around April 15. Care to guess how much of that will go to paying taxes?
In short, I rather doubt the stimulus package will do much good, except that it allows politicians to demonstrate they are concerned about our problems, and willing to spend taxpayer money to prove their concern.
The Economy Continues to Weaken
Briefly, the data is suggesting continued weakness. Even the perma-bullish Art Laffer last night threw in the towel and said on Larry Kudlow's show that we are in the beginning of a recession.
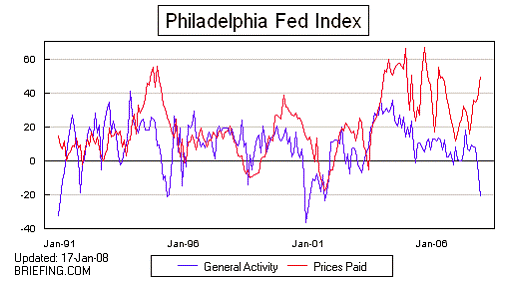
The Philadelphia Fed's Business Survey is suggesting that activity is down to levels not seen since the last recession in 2001. Twice as many firms reported a decrease in business as reported an increase. Employment was down for the first time in years, and new orders were negative. Oh, and 49% of firms said prices paid were up. Last August only 16% said that. Only 2% said they were paying lower prices for input materials. The following chart from Greg Weldon's latest piece says it all:

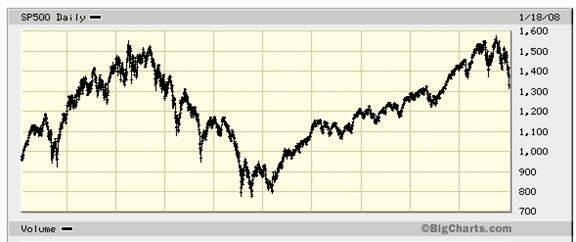
The market has been dropping not just in the US but all over the world. Gentle reader, this is what the beginning of a bear market looks like. This is a chart of the last ten years of the S&P 500. Notice that when the bear market started in the fall of 2000, there were numerous periods where there were 10-15% gains which eventually faded away.

I keep hearing that traders want to see capitulation. Unless we are in a brave new world, you don't see capitulation in one month. This is a longer process, and it will work out in ways that confound us all. Future earnings are going to be under stress as the economy slows. We will get a series of earnings warnings at the end of this quarter, which will further weaken the market. Rebounds are to be sold in this environment.
John Mauldin is president of Millennium Wave Advisors, LLC, a registered investment advisor. Contact John at John@FrontlineThoughts.com.
Disclaimer
John Mauldin is president of Millennium Wave Advisors, LLC, a registered investment advisor. All material presented herein is believed to be reliable but we cannot attest to its accuracy. Investment recommendations may change and readers are urged to check with their investment counselors before making any investment decisions.
|
|