| Weekly Outlook in the Stock Market |
| By Price Headley |
Published
01/22/2008
|
Stocks
|
Unrated
|
|
|
|
Weekly Outlook in the Stock Market
NASDAQ Composite
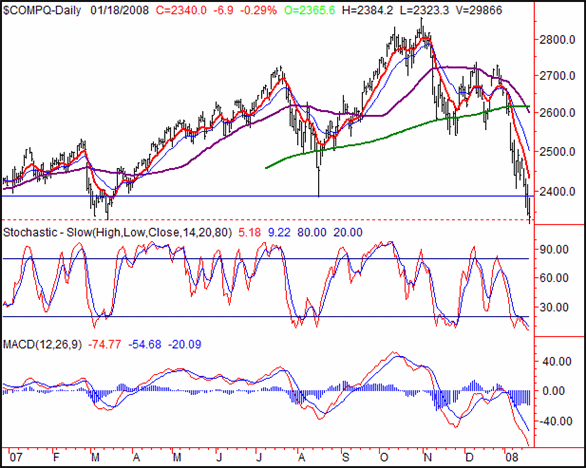
On Friday, the NASDAQ fell 6.88 points, or 0.29%, to end the day at 2340.0. That was 99.9 points below the prior weeks close, a loss of 4.09% (which wasn't even close to being the week's biggest loser - see below). Yet, the NASDAQ has a far worse description; it hit a new 52-week low on Friday.
It's true - the five year bull market we've all been enjoying has now been reduced to four-year levels, and it took just three months to do it.
As for what's next, we'll sit tight on a firm call until next week. The NASDAQ is toying with finding support basically where it was last March, and is way oversold. We wouldn't be surprised to see it stop and turn on a dime at this point; we've already discussed several hints of a bearish burnout.
A continuation under 2330 could inspire further selling. We'd like to see a move above 2434 before getting bullish though.
NASDAQ Composite Chart - Daily

S&P 500
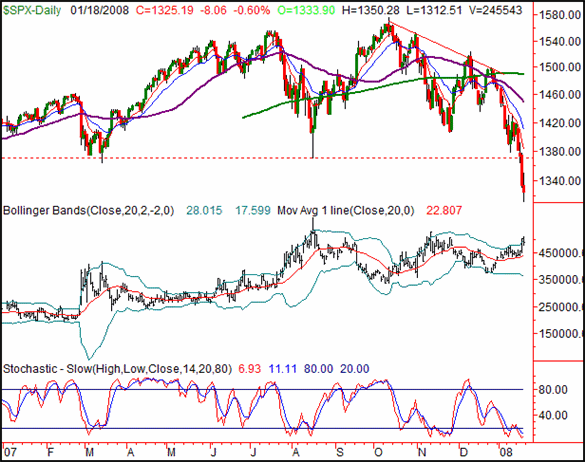
The S&P 500 closed at 1325.19 on Friday, lower by 8.06 points, or 0.6%. For the week the SPX fell by 75.83 points, or 5.41%, the week's biggest loser. It was a real blow to the large caps, which had been leading the market until recently.
In fact, the weakness of the large caps may be best illustrated by this: the S&P 500 is well into new 52-week-low territory.
One of the few upside catalysts we see at this point is the VIX. It peaked at 28.51 on Thursday, briefly trading above the upper Bollinger band (20 day). On Friday it was reeled in after a slightly higher reading than Thursday's, closing out at 27.18. The asterisk next to that comment, however, is that it was also an option expiration week. So, who knows if the VIX was skewed or not? On the other hand, the piper still has to be paid somehow. Expiration week or not, the VIX was last left at levels a little too high to be sustained; only a stock rally could really unwind it in a meaningful way. (Then the question becomes one of 'when?')
As with the NASDAQ, we're going to sit tight on the SPX and see what the coming week holds. We still think we're at or near a short-term bottom, accented by a slight selling rush before a three day weekend. However, we'll let the market confirm it first.
S&P 500 Chart - Daily

Dow Jones Industrial Average
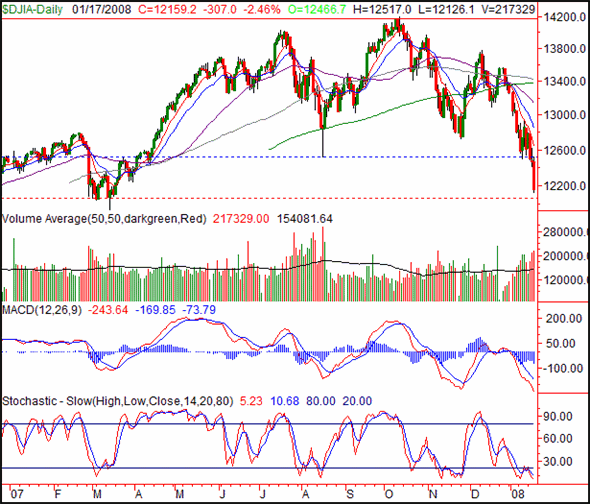
The Dow lost 3.55% for the week last week, most of it thanks to Friday's 2.46% selloff. That was a 447.1 point drop and 307.0 point drop, respectively, leaving the Dow at 12,159.2 when it was all said and done. A key support line (August's low of 12,517) was broken, and another one (March's lows around 12,050) is just a few points away for the blue chip index's current level. Though we tend to agree that 'it couldn't get much worse', we're not ruling out the possibility of 'even worse'. The 12,050 will tell that story when (if?) it needs to be told.
Dow Jones Industrial Average Chart - Daily

Bonus Commentary
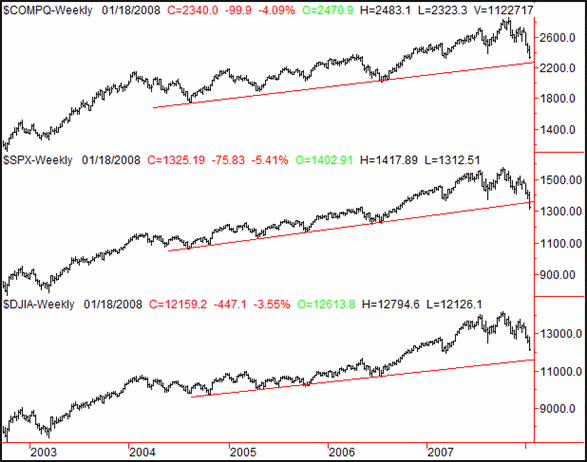
We included this chart last week, but we felt it was important enough to show you this week's update. The S&P 500's long-term support line was been toppled, while the major support lines for the other two indices haven't yet been touched. All three suggest further downside could be in store, though the SPX's for a different reason - a break down. We have to wonder if the NASDAQ and the Dow will go ahead and 'clean up' these charts by falling all the way to those levels before finally making a reversal effort (not that they have to do so to recover).
Major Indices with Support Lines - Weekly

Price Headley is the founder and chief analyst of BigTrends.com.
|