| Corcoran Technical Trading Patterns for January 28 |
| By Clive Corcoran |
Published
01/28/2008
|
Stocks
|
Unrated
|
|
|
|
Corcoran Technical Trading Patterns for January 28
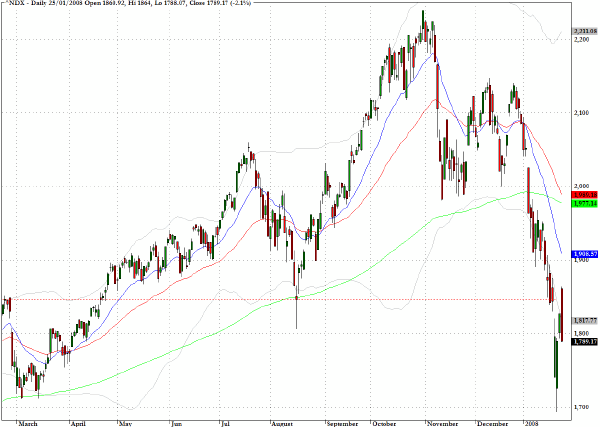
The Nasdaq 100 (^NDX) reversed sharply on Friday after piercing through, in early trading, the indicated chart resistance. Along with the rest of the market, the index succumbed to the tendency which highlights the current market predicament of rallies being seen as providing an opportunity for fund managers to liquidate long positions and better entry possibilities for traders that want to exploit the short side again.
The 1900 level represents a major hurdle on the upside, but I sense we may go down today to test the lows again before there is any appetite for looking at overhead barriers.
Among the many things that the market has to contend with this week are the FOMC deliberations, Friday's employment data, the fate of the so-called monoline insurers, further negative earnings, etc., and of course whether we get any new financial accidents a la SocGen. Despite all of the protestations about the soundness of the fundamentals - "It's the financial system, stupid."
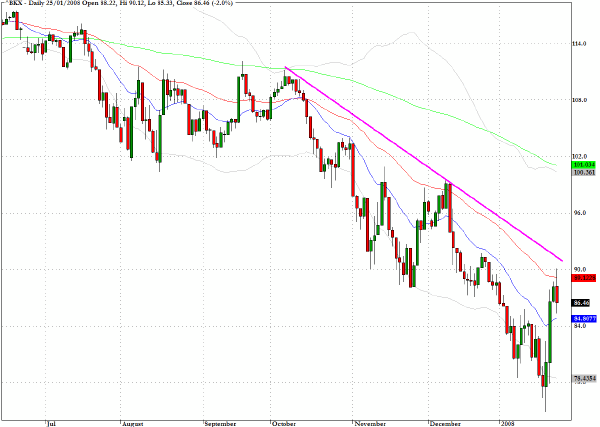
The banking index (^BKX) just made it to the 90 level on Friday where, as expected, there was very firm resistance. As the chart reveals, the sector has a formidable obstacle to clear, and despite all of the positive rhetoric that is starting to surface about how bargains abound among the regional and relatively well capitalized banks, there is still too much financial uncertainty for anyone to claim that a meaningful bottom is in place.
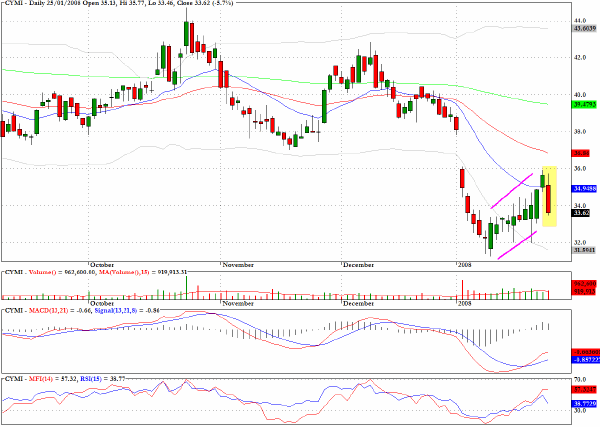
We made money on both sides of the market last week with CYMI which reversed in Friday's trading as anticipated.
The chart for Goldman Sachs (GS) has an evening star candlestick which on a statistical basis has been a reliably bearish pattern.

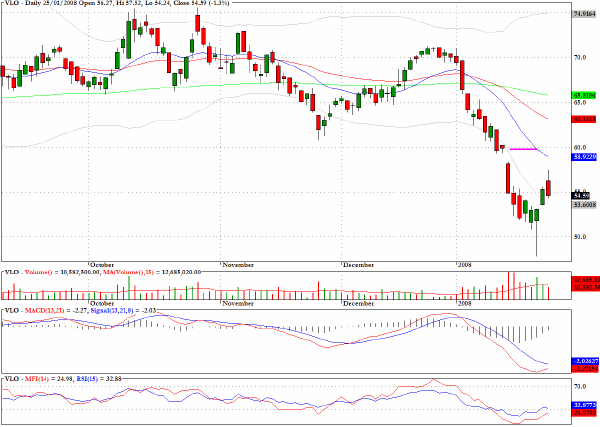
Valero (VLO) looks vulnerable at current levels and even more so as it gets closer to $60.
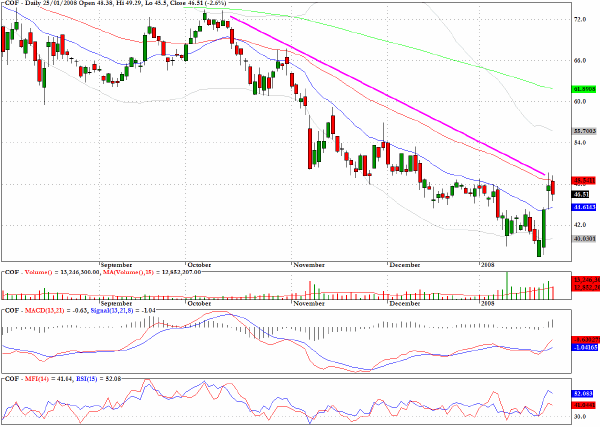
The chart for Capital One Financial (COF) highlights the hurdle that many companies face in the financial services sector.
Career Education Corp (CECO) is developing a well-defined bear flag formation.

Clive Corcoran is the publisher of TradeWithForm.com, which provides daily analysis and commentary on the US stock market. He specializes in market neutral investing and and is currently working on a book about the benefits of trading with long/short strategies, which is scheduled for publication later this year.
Disclaimer
The purpose of this article is to offer you the chance to review the trading methodology, risk reduction strategies and portfolio construction techniques described at tradewithform.com. There is no guarantee that the trading strategies advocated will be profitable. Moreover, there is a risk that following these strategies will lead to loss of capital. Past results are no guarantee of future results. Trading stocks and CFD's can yield large rewards, but also has large potential risks. Trading with leverage can be especially risky. You should be fully aware of the risks of trading in the capital markets. You are strongly advised not to trade with capital.
|