| Stock Market Indexes at Fibonacci Retracement Lines |
| By Price Headley |
Published
01/31/2008
|
Futures , Stocks
|
Unrated
|
|
|
|
Stock Market Indexes at Fibonacci Retracement Lines
It's getting pretty hairy out there. The Fed gave traders an emergency 3/4 percent rate cut a little over a week ago, and another 1/2 percent cut yesterday. Did the market like it? Yes, for about an hour. By 3 p.m. EST the tide had turned in favor of the bears again and pulled the indices underwater.
What gives? The market it going to do whatever investors want it to do. By that same token, investors don't always say, or even know, what they're going to do. In fact, investors are pretty notorious for doing the opposite of what they say they intend to do.
I have to wonder if some long-term Fibonacci lines are what's framing things now. A lot of hedge funds look at Fibonacci retracement (about as unfundamental as you can get) as entry and exit points. And when I say long-term, I mean long-term. The low we used as our basis was the end of the bear market and the beginning of the bull market -- from 2002! Could they be the root of the volatility?
As I started to look through all the long-term Fibonacci lines, I was surprised to see how well all the major indices fit the Fibonacci mold.
NASDAQ Composite
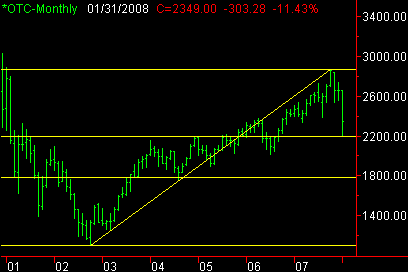
From the 2002 low of 1108 to the recent peak of 2861, we can see that this month's low of 2202 is basically a 38.2% retracement.
NASDAQ Composite with Fibonacci lines - monthly

S&P 500
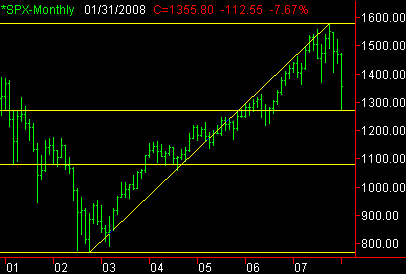
In 2002, the S&P 500 hit a low of 768 before reaching 1576 in October of last year. This month's low of 1270 is basically a 38.2% retracement of that move.
S&P 500 with Fibonacci lines - monthly

Dow Jones Industrials
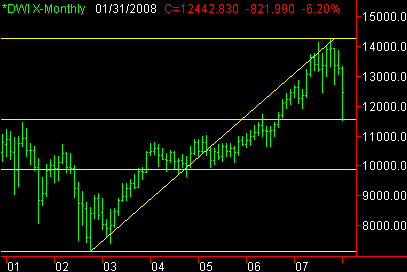
Same story here. After reaching 7177 in 2002 and 14,280 in October, we've seen a little more than a 38.2% retracement of that distance with this month's low.
Dow Jones Industrials with Fibonacci lines - monthly

Pretty interesting, huh? My only problem with the Fibonacci lines is what do you do with them once you have them drawn? All the indices seemed to find support at that 38.2% retracement level for now, but who's to say that won't fail a retest? Or, who's to say they won't continue pushing higher after touching them a few days ago.
According to the traditional interpretation of Fibonacci lines, once a key retracement line shows support, then it continues to act as support. In the rare case where it breaks though, then the index is usually in for more significant selling. Nonetheless, I'm finding this tool to be a great frame of reference - particularly right now.
Price Headley is the founder and chief analyst of BigTrends.com.
|