| The McMillan Options Strategist Weekly |
| By Lawrence G. McMillan |
Published
02/1/2008
|
Options
|
Unrated
|
|
|
|
The McMillan Options Strategist Weekly
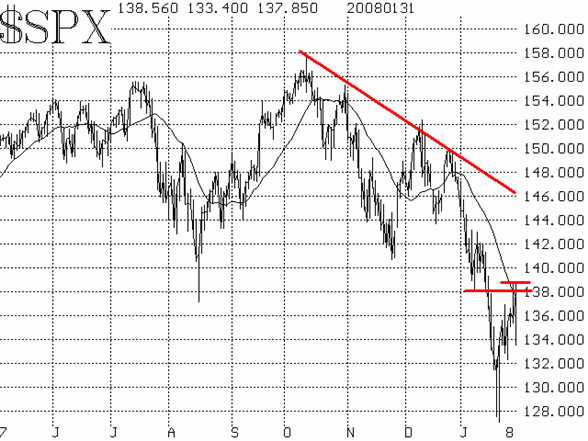
$SPX has support at 1310 and 1330 (Wednesday's low) and resistance at 1385 (Wednesday's and Thursday's high). Overall, the $SPX chart is still a negative one, with a declining 20-day moving average that has not yet been exceeded by the index price. There is further resistance on the $SPX chart up to 1420-1430. A close above there would turn the chart bullish, but that is some distance off at this point.

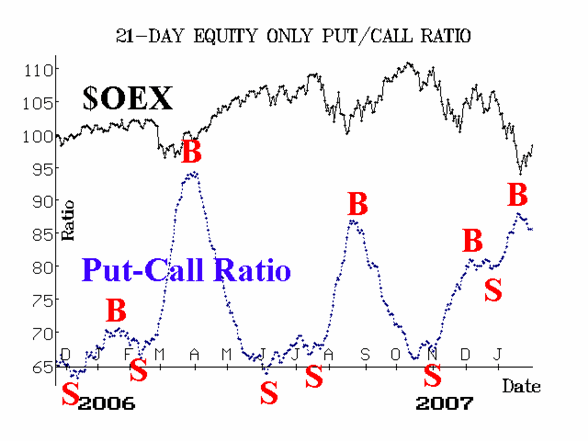
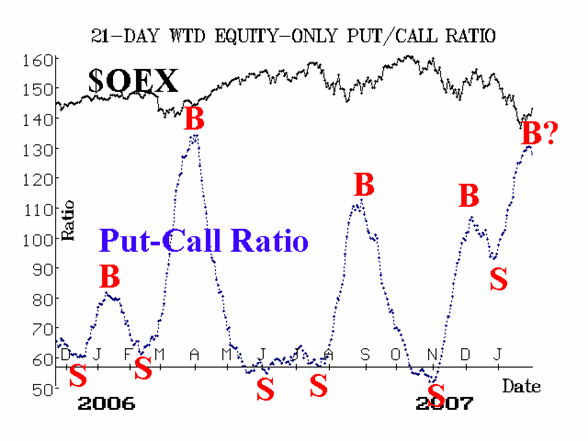
Equity-only put-call ratios are finally both on buy signals -- at least, according to our computer analysis software. The standard ratio remains on the buy signal that was generated late last week, while the weighted ratio -- while extremely high on its chart, and thus "oversold"-- had not been able to generate an accompanying buy signal of its own until tonight.

Market breadth has been much better in the last 10 days or so. So breadth is on a buy signal.

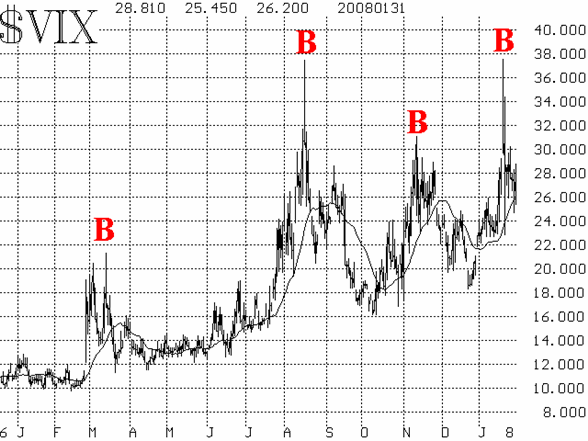
Volatility indices ($VIX and $VXO) continue to be important drivers and guideposts in this market. Both gave spike peak buy signals last week, and those buy signals remain in effect. However, $VIX has been unable to close below its 20-day moving average; if it would, that would be an important bullish confirmation.

In summary, most of the indicators are bullish. There is also the matter of the January Seasonal period, which ends today, but probably could continue into the first few trading days of February. However, the omissions are not trivial: $SPX remains below its 20-day moving average, and the weighted put-call ratio needs to confirm its rollover to a buy signal. Even so,
we're inclined to remain long "something" as long as the majority of the indicators are bullish.
Lawrence G. McMillan is the author of two best selling books on options, including Options as a Strategic Investment, recognized as essential resources for any serious option trader's library.
|