| Dow Short ETF (DXD) Again Trading Beneath Prior Rally Peak |
| By Mike Paulenoff |
Published
02/4/2008
|
Stocks
|
Unrated
|
|
|
|
Dow Short ETF (DXD) Again Trading Beneath Prior Rally Peak
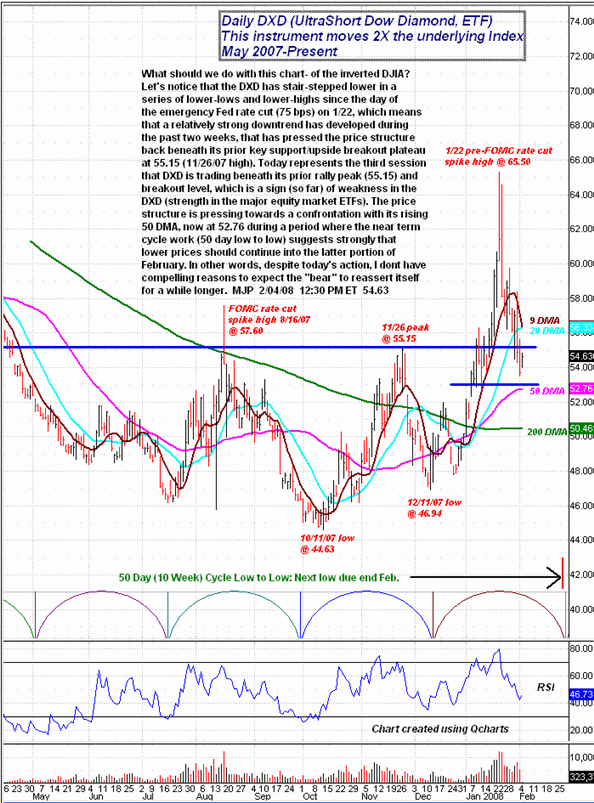
Let's take a look at the pattern and technical underpinnings that have developed in the UltraShort Dow Diamond ETF (DXD). What should we do with this chart of the inverted DJIA? Let's notice that the DXD has stair-stepped lower in a series of lower-lows and lower-highs since the day of the emergency Fed rate cut (75 bps) on January 22, which means that a relatively strong downtrend has developed during the past two weeks that has pressed the price structure back beneath its prior key support/upside breakout plateau at 55.15. Today represents the third session that the DXD is trading beneath its prior rally peak (55.15) and breakout level, which is a sign (so far) of weakness in the DXD (strength in the major equity market ETFs). The price structure is pressing towards a confrontation with its rising 50 DMA, now at 52.76 during a period where the near-term cycle work (50 day low to low) suggests strongly that lower prices should continue into the latter portion of February. In other words, despite today's action, I don't have compelling reasons to expect the "bear" to reassert itself for a while longer.

Mike Paulenoff is a 26-year veteran of the financial markets and author of MPTrader.com, a real-time diary of his technical chart analysis and trading alerts on all major markets. For more of Mike Paulenoff, sign up for a free 15-Day trial to his MPTrader Diary by clicking here.
|