| Weekly Outlook in the Stock Market |
| By Price Headley |
Published
02/4/2008
|
Stocks
|
Unrated
|
|
|
|
Weekly Outlook in the Stock Market
NASDAQ Composite
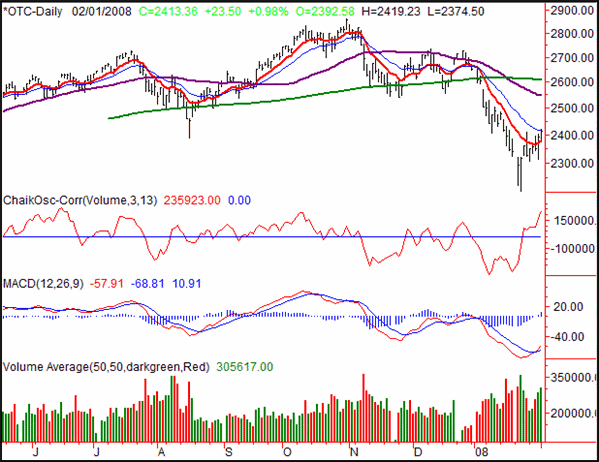
The NASDAQ's big 2.74% rally on Friday left it at 2413.4, up 64.4 points from Thursday's close. For the week, the index closed 3.75% higher, up 87.2 points. It was the first positive week in the last six, perhaps pointing to an end of the pain - for the time being anyway.
Most of our pep-talk today is focused on the S&P 500 and the Dow, but a couple of key things about the NASDAQ's chart caught our eye. Even though the composite showed us a nice gain, the NASDAQ still has a ton of room to go before getting back to its 200 -day average (green). It's still under the 20-day average (blue). And, there's a lot of room to go before the NASDAQ retests a resistance line (red, dashed) very near there. While it may only be in the short-term, that's trade-worthy potential, about 200-points worth. With a bullish MACD crossover in place, that seems to be the higher-odds direction.
Also, notice how bullish volume is growing. We're interpreting those bullish hints at face value.
NASDAQ Composite Chart - Daily

S&P 500
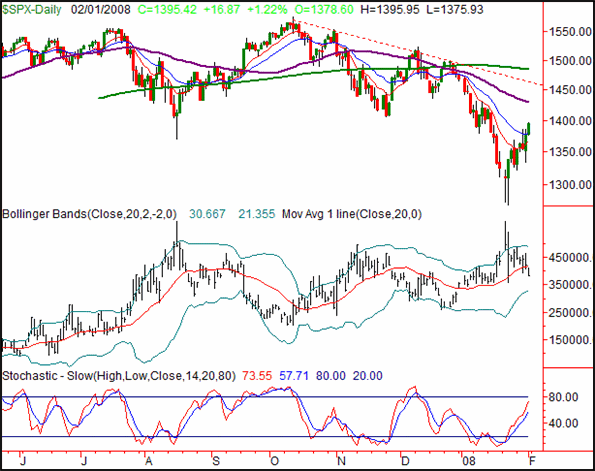
After climbing 16.87 points (+1.22%) on Friday, the SPX ended the session at 1395.42. That was 64.81 points (+4.87%) better than the prior Friday's close, making the large cap index the big winner for the week. Perhaps more importantly, we finally saw the index close back above its 10- and 20-day averages, for the first time in about a month.
The real storey here is the VIX. After making a spike well above the upper Bollinger band on the 22nd, we've seen it pullback, closing under its 20-day moving average lie just yesterday. With some room left to go before it finds a floor at the lower Bollinger band, the SPX could have some room to rise before tested.
The VIX is likely to test that lower band right around the same time the SPX bumps up into a major resistance line (red, dashed) at 1463 (and falling). That line is framed between the 50-day average (purple) and the 200-day line (green), either of which could also act as a ceiling.
For the time being we'll side with the trend and get bullish. However, last week's move will be a tough act to follow. Don't be surprised if we see a small dip sometime in the coming week to cool things off a little. It's how the market responds to that action that will be so telling.
As long as the 10-day line (or 20-day) holds as support, we'll remain bullish. If those lines fail to hold the market up though, we're actually looking for another selloff probably around the same size as the last two, close to 200 points.
S&P 500 Chart - Daily

Dow Jones Industrials
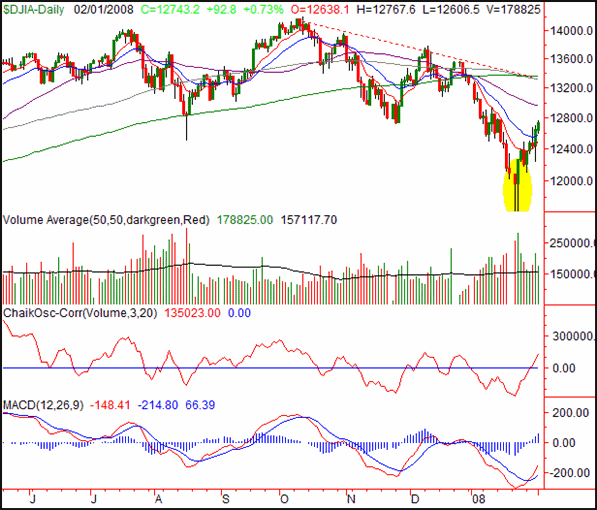
The Dow trailed the rest of the market on Friday, only gaining 0.73% (+92.8 points), to end the day at 12,743.2. On a weekly basis, the blue chip index added 536 points to the tally, or +4.39%. To see that kind of action after the long-tailed reversal bars from the 22nd and 23rd isn't a surprise, and there may be more of the same in store as the Dow works of this oversold condition.
That long-tailed reversal is highlighted in yellow in the chart below. Adding to the possible 'pivot' action is the volume spike we saw the same day -- often an indication of a blowout/capitulatory effort.
Since then, we've seen the bullish volume sustained. Thus, we also saw the Chaikin line cross back above zero. As you can see, such crosses have been pretty good indications of a bullish swing.
Of course, not all the Chaikin line crosses above the zero level have been useful. In this case though, the bulls have the benefit of adding in a MACD crossover. The last two MACD crosses that occurred under the zero level have been positive signs (the first from Aug. 24 more so than the second one from Nov. 29).
What's the upside potential here? The upside swing have been short lived; the chart clearly shows that. Based on what we've seen the last few weeks, we're not counting on anything past that falling resistance line (red, dashed), or the 100-day and 200-day lines (grey and green, respectively). As you can tell, all of those levels are right around 13,336, and falling a little each day. So, there may be another 600 points worth of buying left in the gas tank before we get a real test.
If the Dow can break past all those ceilings, we'll look for a lot more upside. If they falter and roll over, then the next bearish leg may be even worse than the last two. At the point, we're technically talking about bear-market moves. We'll burn that bridge when we come to it.
Dow Jones Industrials Chart - Daily

Price Headley is the founder and chief analyst of BigTrends.com.
|