| Corcoran Technical Trading Patterns for February 5 |
| By Clive Corcoran |
Published
02/5/2008
|
Stocks
|
Unrated
|
|
|
|
Corcoran Technical Trading Patterns for February 5
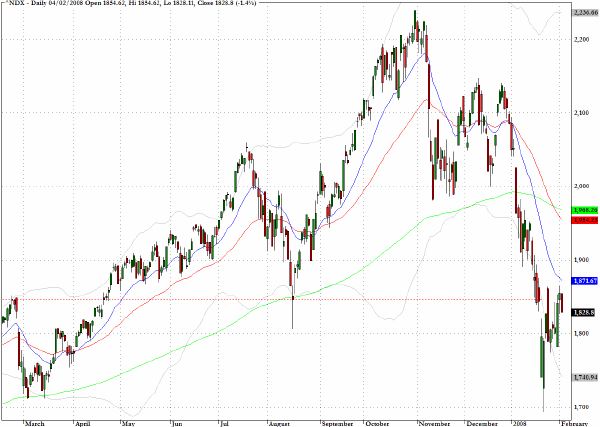
Significant overhead chart resistance, apparent not only on many of the US stock indices but also on other global stock index charts, proved to be a barrier and interruption to the recent Fed easing inspired recovery efforts. The Nasdaq 100 (^NDX) is clearly having difficulties breaking through the area of chart resistance in the neighborhood of 1850 that I was pointing to last week.
The peaks in January and late February 2007 were just below this level and the late February peak of 1846 immediately preceded sell-off that first registered the broad market's concerns about problems in the credit markets. The August 16th sell off turned around (at least on a closing basis) at 1846 and intriguingly this very same level has been confining the recovery efforts during the last two weeks.
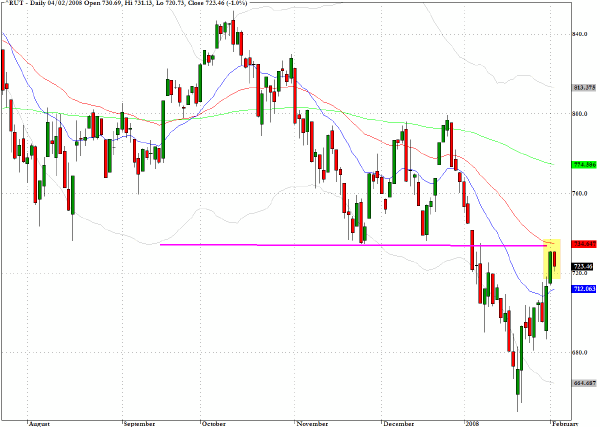
The Russell 2000 (^RUT) still has some distance to cover before it makes its way back to the August 16 closing low of 768 but encountered resistance yesterday at the 50-day EMA. A more critical testing episode for the small cap index should arise about 40 to 50 points above yesterday's close on this index.
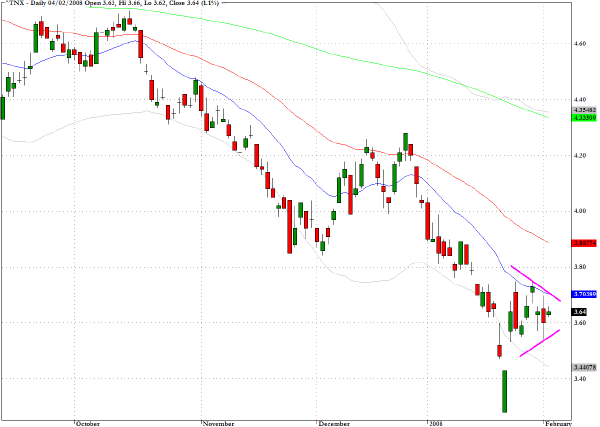
The chart for yield on the ten year Treasury note (^TNX) suggests that there is indecision among traders and asset allocators regarding the likely severity of the economic slowdown.
Yields broke down in mid-January from the trading range that had been in place for more than three years - between 3.75% and 5.25% - and we looked headed down to a new range with 3.25% as a lower boundary. The developing triangular pattern suggests that traders may be having second thoughts about how severe the slowdown may be and that a re-entry into the previous range is a distinct possibility.
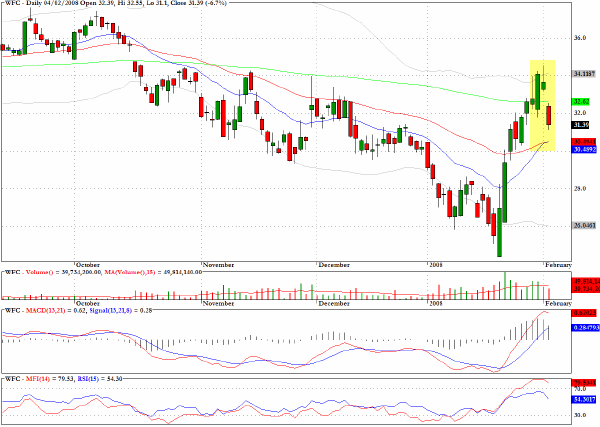
As suggested last week for Wells Fargo (WFC), the shooting star pattern, almost exactly at the 200-day EMA, suggested that a period of retrenchment was imminent. The stock gave back 6.7% yesterday.
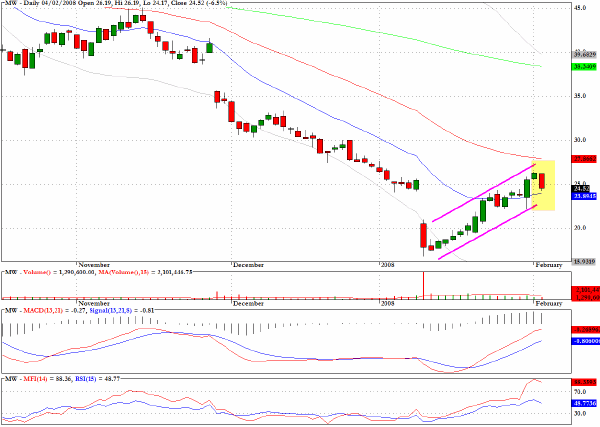
Also noted last week, Men's Wearhouse (MW) looked susceptible to further weakness from the bear flag formation and yesterday, in similar fashion to WFC, it too dropped by almost seven percent.
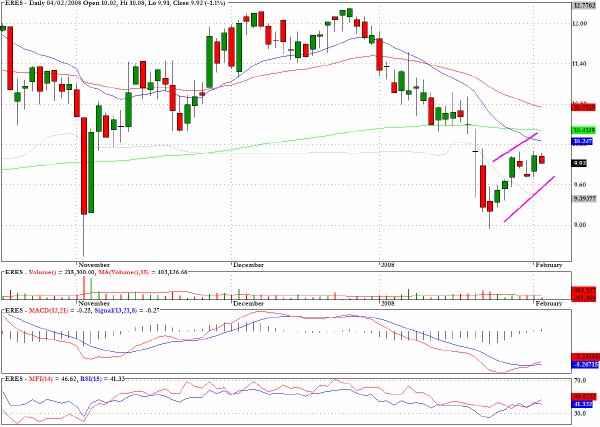
eResearch Technology (ERES) looks vulnerable as it tries to break above $10.
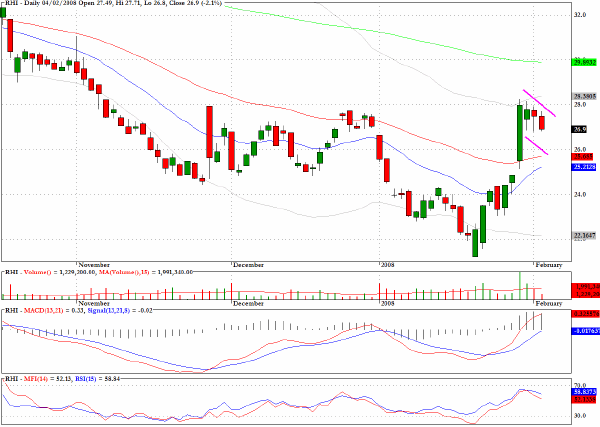
Robert Half International (RHI) is developing a bullish pullback/flag pattern and I would expect to see higher prices ahead.
Clive Corcoran is the publisher of TradeWithForm.com, which provides daily analysis and commentary on the US stock market. He specializes in market neutral investing and and is currently working on a book about the benefits of trading with long/short strategies, which is scheduled for publication later this year.
Disclaimer
The purpose of this article is to offer you the chance to review the trading methodology, risk reduction strategies and portfolio construction techniques described at tradewithform.com. There is no guarantee that the trading strategies advocated will be profitable. Moreover, there is a risk that following these strategies will lead to loss of capital. Past results are no guarantee of future results. Trading stocks and CFD's can yield large rewards, but also has large potential risks. Trading with leverage can be especially risky. You should be fully aware of the risks of trading in the capital markets. You are strongly advised not to trade with capital.
|