The January Effect has a few definitions, all of which can provide investors with profit-generating strategies.
Now that the first month of 2008 is in the rear view mirror, it may provide us with more insight on the next 11 months. In fact, after reading this you may want to adjust your portfolio strategies for 2008! But first back to basics: The January Effect has a few definitions, all of which can provide investors with profit-generating strategies. First, historical data has shown the stocks perform better in January than any other month. Second, it's said that small capitalization stocks will do better than larger capitalization stocks.
Obviously, these January Effect definitions did not materialize in 2008, as we say major losses and small caps barely outperformed, but what about the other January Effect? The final, widely accepted definition states that the performance in January properly forecasts the annual outlook. Given this information investors can take this past January's performance and put their money in the right place. So, how dependable is this indicator, and can you put your investments at risk based on the January Effect?
Cynics verbalize that the January Effect is null or void based on the inherent bullish bias in the market. In other words, the market is more likely to experience gains than losses, and the historical patterns on the January Effect can be explained in those terms. This criticism may be reaching the conclusion too quickly--there is this indicator that should be discovered.
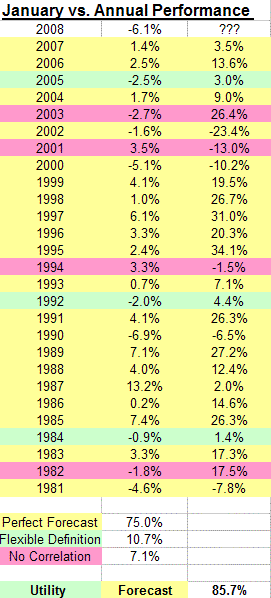
We took a look at the SP500 back to 1981 to test the validity of the January Effect. Take a look below at the chart depicting January versus annual performances and how they correlate. The yellow highlights are positive correlations, but the most important years are highlighted in green and magenta; they show years that don't fit the typical definition. Specifically, look at the green years. 
Objectively looking at the chart above you'll first notice that in 2003 the indicator was proven incorrect by a long shot. This statistical abnormality (historically speaking) could signify that it's time to revert back to the normal pattern; the recent years represent results outside the normal bell curve. Looking back, the indicator was correct 75% of the time.
Since 2008 has started out at a loss, let's look at those years that began negative; are they more or less likely to gain over the remaining 11 months?
Even though the majority of instances proved the January Indicator correct, the most useful are those that did not. Many of those years that do not fit in the topical definition express more forecasting value that those that do. Take a look at the years highlighted in green. These years represent those that ended positive and yet began negative in January (2005, 1992, and 1984). In these years the annual performance was less than average or very poor. In fact all of these years were below 5%. Bottom line is that your capital would have been better invested elsewhere.
Now that you've seen the facts, what do you do in 2008? Historically speaking, there is an 85.7% chance that 2008 will close in the red or post less than 5% gain. There are far more risk-free opportunities out there that will provide more than 5% gain. High Yield savings accounts come to the front of my mind, but what about the rest of your portfolio (assuming proper diversification into traditional investments)? Options can provide that diversity.
With these facts you should be looking at anything other than buy and hold long term investments for 2008. Options can provide income or growth in any investing environment.
Price Headley is the founder and chief analyst of BigTrends.com.