| End of the Bull Market? |
| By Price Headley |
Published
02/6/2008
|
Options , Stocks
|
Unrated
|
|
|
|
End of the Bull Market?
No big surprise that the market is working on a rebound today - if you drop anything from high enough, it'll bounce. The question is, how much will it bounce?
I know a lot of pundits and so-called experts are bullish here. The Fed is pulling out all the stops, and tons of 'values' have been left behind after the recent correction. While I certainly see the potential bullish trades in all of that, I've recently noticed something that could be a game-changer.
Regular readers will recall we often use the 200-day moving average line as a long-term indicator line. We're not the only ones; it seems to be a favorite for many analysts (technical or not). However, with all the recent noise and chatter, I have to wonder if a lot of us have overlooked something pretty big.
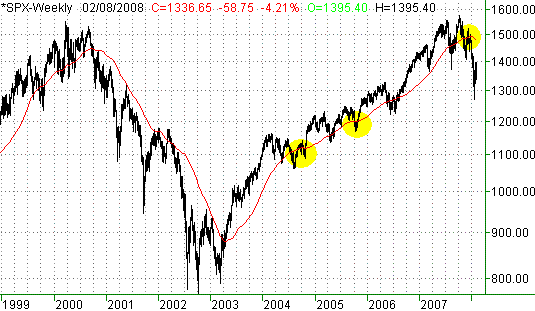
What's so big now about the 200-day moving average line? This is almost the most time we've spent under it since the 2000/2002 bear market (which officially ended in early 2003). Using the S&P 500 as the guinea pig, 'the market' has been under its 200-day average for 27 trading days. In the fall of 2004 we actually spent about 30 days under the 200-day line, but with a much more bullish temperament then than the one we have now. Besides, we're really nowhere near within striking distance of the 200-day line now, so we're going to surpass the 30 mark by the end of this week.
Regardless, the point we're making now is that something much bigger than usual could be wrong. It doesn't matter which index you're looking at - it's true for all of them.
S&P 500, with 200-day (40-week) average line - Weekly

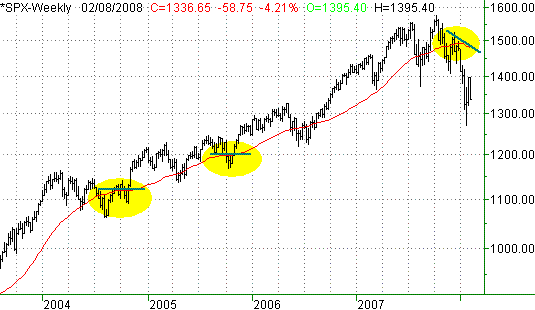
Perhaps more bearish is this factoid: the 200-day line is now sloped lower (in a significant way) for the first time during the entire bull market. We saw a brief - almost imperceptible - decline in the 200-day line in October of 2004 and October of 2005. However, it hasn't been this bearishly angled since 2002. The short green lines below follow the direction of the 200-day line when it started to slope lower. Clearly things are much more severe now than they were before.
S&P 500, with 200-day (40-week) average line - Weekly

So what? Taking this reality at face value, the long-term trend has turned bearish. For the past five years, short-term pullbacks were eventually corrected by the long-term uptrend. Now, there's not a long-term uptrend. We're making lower lows and lower highs.
So it's all over but the cryin'? We're in a bear market? I don't want to say that just yet, because the market may well pull itself out of the fire. However, we've seen nothing yet that really says all is well...dead-cat bounces don't count.
That's important to understand too. Even if we're in a bear market now, stocks can rally quite sharply - for a while. To really wipe the slate clean, we need to see the S&P 500 (or any index) make a higher high and higher low in addition to getting back above the 200-day moving average. The SPX could rally another 7% and still not accomplish that.
So here's what we're watching out for: a key bearish cross-under of other moving averages under the 200-day line. All the major lines (10, 20, 50, and 100-day lines) are under the 200-day line. However, we've not seen one of them cross under another yet...not while under the 200-day average. If we see that, we'll know the market tried to recover, but failed. At that point, other sell/bearish signals tend to take on a whole lotta' meaning. And yes, that's when we have much more evidence of a bear market.
Don't get stressed. If you have good systems and money management rules in place, you can navigate any environment, and profit quite well from it. That's why we don't really care what the market is doing. In fact, bearish trends are usually more violent, which means options traders (like us) can generate profits very rapidly.
Again, watch for the next key cross-under that occurs below the 200-day average.
Price Headley is the founder and chief analyst of BigTrends.com.
|