| Corcoran Technical Trading Patterns for February 7 |
| By Clive Corcoran |
Published
02/7/2008
|
Stocks
|
Unrated
|
|
|
|
Corcoran Technical Trading Patterns for February 7
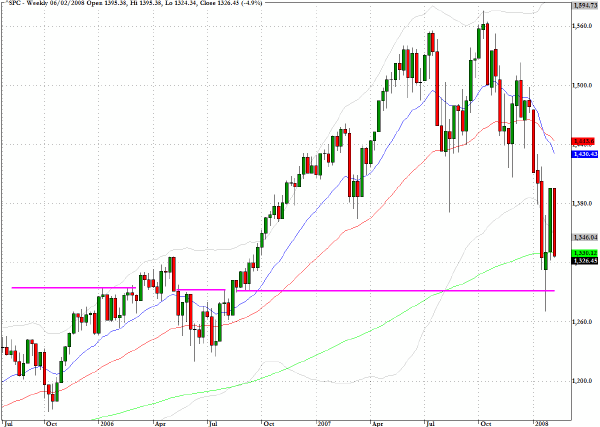
After celebrating the Fed's largesse last week, the markets have now given back most of the gains made with three consecutive down days. As the weekly chart below shows, the red bar for the week so far shows an almost complete reversal of last week's green candlestick. Also evident is the proximity to the 200-week EMA. However the January lows below 1300 look as though they will need testing before fund managers get some clarity on whether the Fed is able to avert the gloomier scenarios that keep rearing their heads whenever adverse data and earnings reports surface.
The chart could also lead one to the conclusion that any near-term testing may not ultimately reassure those managers who are currently hiding out, before the extent of the downturn is better gauged. It is not hard to imagine that the 1260-1280 area, which is a key level from the last three years as well as coinciding with a critical long term uptrend line, will be a target in the intermediate term. A decisive break below 1260 would definitely confirm for me that the bullish dynamics that prevailed from spring 2003 to late 2007 have been broken.
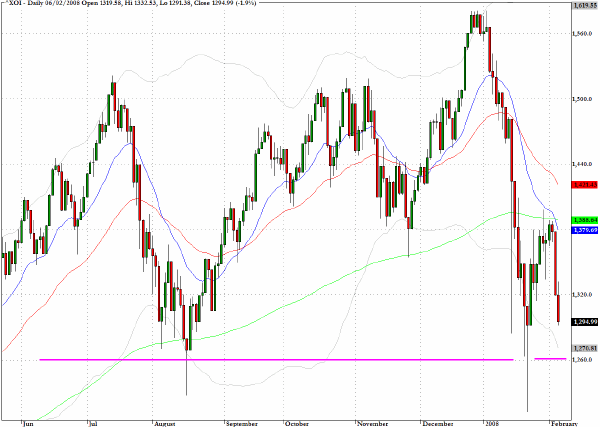
The oil index (^XOI) is also approaching a key level.
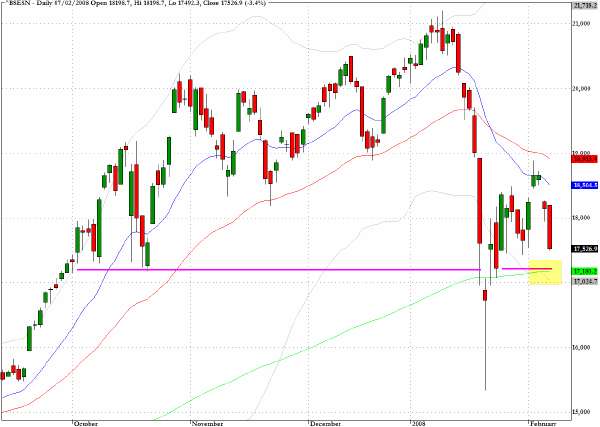
With many Asian markets closed today and tomorrow, the action on the Mumbai Exchange (^BSESN) in overnight trading caught my attention. The index opened on its high for the session and then dropped quite sharply into the close as it registered a 3.4% loss for the session.
The 200-day EMA and some chart support exists about two percent below today's close.
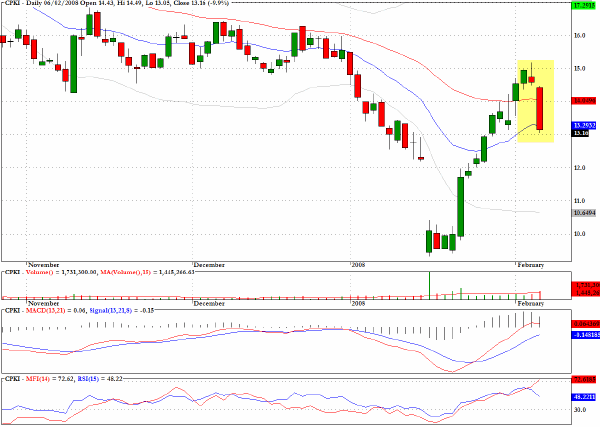
On Monday I mentioned that I would be stalking California Pizza Kitchen (CPKI) for an entry on the short side and yesterday the stock rewarded nicely with an almost ten percent plunge.
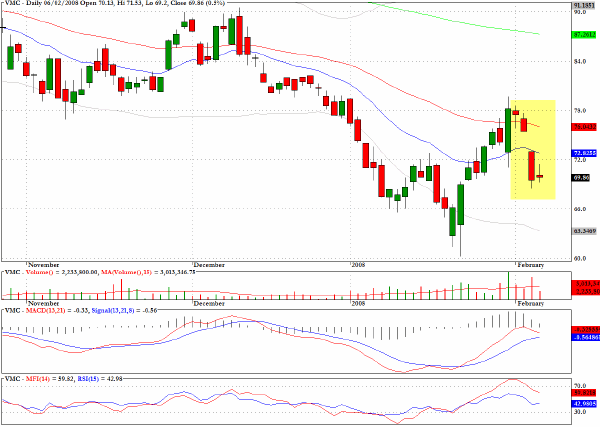
Another recent recommendation was for Legacy Vulcan (VMC) where I suggested that there could be an abrupt short term reversal near to chart resistance at the $78 level.
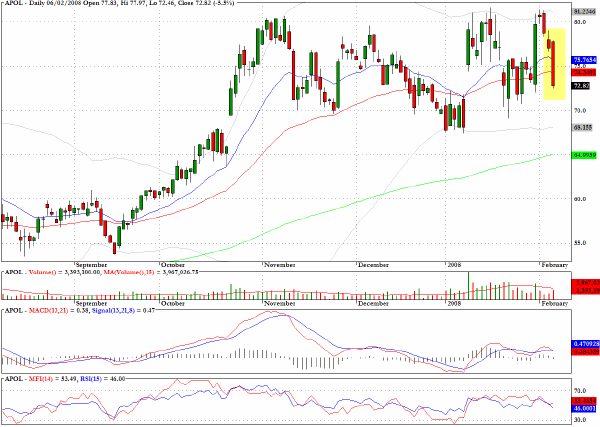
Apollo Group (APOL) dropped below two key moving averages on a pickup in volume.
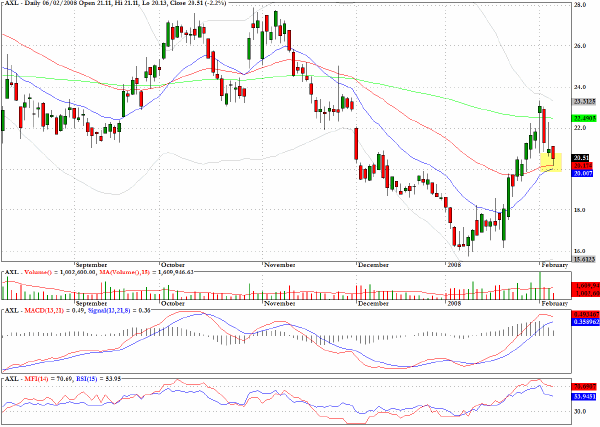
American Axle (AXL) could find support at the intersection of two moving averages.
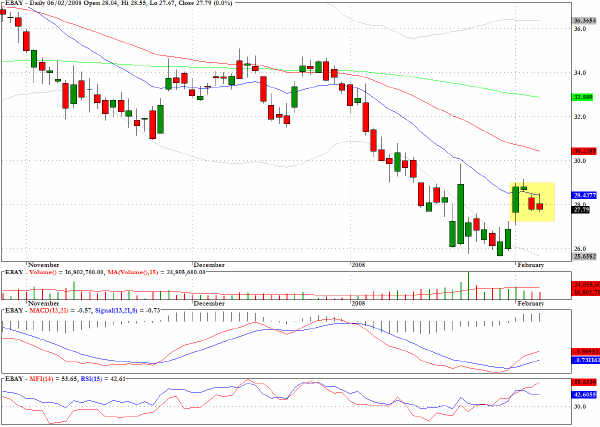
I still like the short term long side prospects for EBAY.
Clive Corcoran is the publisher of TradeWithForm.com, which provides daily analysis and commentary on the US stock market. He specializes in market neutral investing and and is currently working on a book about the benefits of trading with long/short strategies, which is scheduled for publication later this year.
Disclaimer
The purpose of this article is to offer you the chance to review the trading methodology, risk reduction strategies and portfolio construction techniques described at tradewithform.com. There is no guarantee that the trading strategies advocated will be profitable. Moreover, there is a risk that following these strategies will lead to loss of capital. Past results are no guarantee of future results. Trading stocks and CFD's can yield large rewards, but also has large potential risks. Trading with leverage can be especially risky. You should be fully aware of the risks of trading in the capital markets. You are strongly advised not to trade with capital.
|