| The McMillan Options Strategist Weekly |
| By Lawrence G. McMillan |
Published
02/8/2008
|
Options
|
Unrated
|
|
|
|
The McMillan Options Strategist Weekly
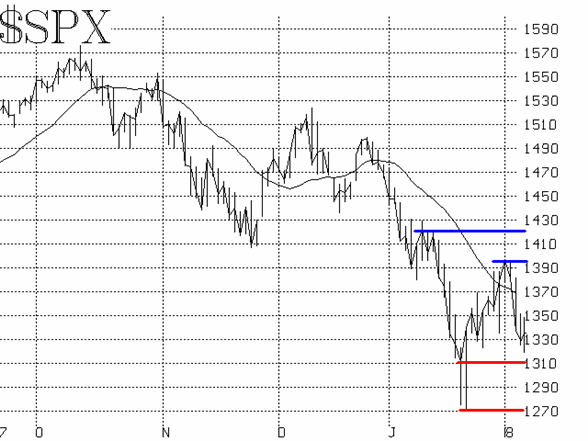
The bulls' hopes came alive with the strong rally in late January that carried the S&P 500 Index ($SPX) over 120 points higher, while the Dow rose over 1,000 points. In fact, the rally was even larger than that, if you count the intraday lows made in overnight, Globex trading on the Martin Luther King holiday and the ensuing night. Nevertheless, reality returned quickly with Tuesday's large plunge across every sector and index.
This action tells us a few useful things: 1) volatility is not diminishing, and one should not expect it to anytime soon, 2) the market has outlined a trading range, with support near 1265 on $SPX and resistance at the recent highs, at 1395. Inside of that range, there is also support at or just above 1310 (which was an overnight low last week and was re-affirmed today). Overall, though, the $SPX chart is negative in that the 20-day moving average is still declining, and the index could not hold above that moving average on its most recent rally attempt.

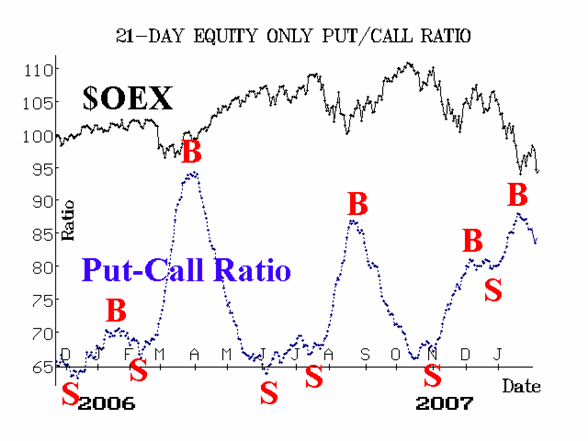
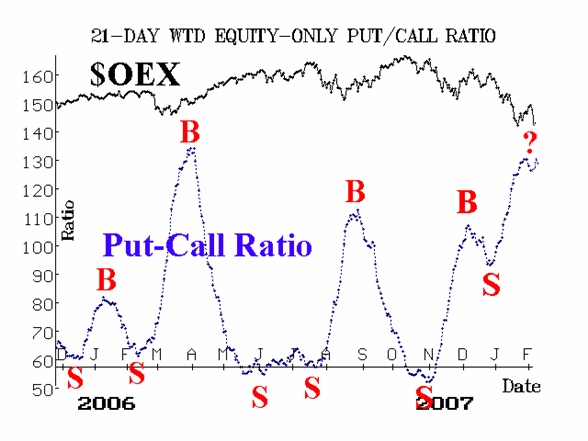
In general, our indicators are mixed. The equity-only put-call ratios are both still on buy signals, according to the computer. However, as you can see from the accompanying chart of the WEIGHTED ratio, the naked eye tells you something quite different: it has almost reversed back to a sell signal (which it would if it makes a new high). So, despite the computer's "What, me worry?" attitude, we are keeping a close eye on the weighted ratio.

Market breadth (advances minus declines) has become a better indicator of the next buy signal, and they are negative at this time.

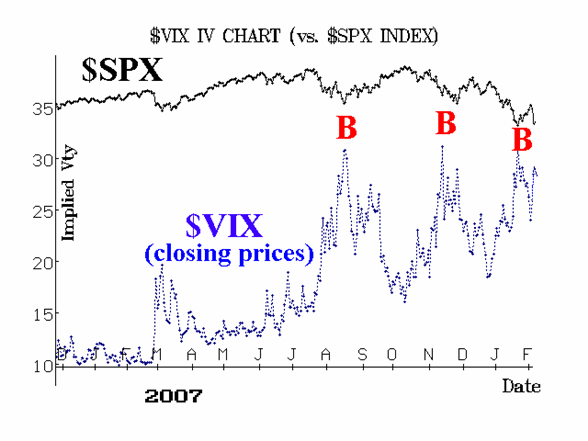
Finally, the volatility indices ($VIX and $VXO) have been, well, volatile once again. The spike peak buy signal when $VIX poked above 37 in mid-January is still in place. So, from that perspective, $VIX is positive. However, on the shorter-term it has stopped declining, and $VIX would flash a new sell signal if it climbed above 30, but would reinstate a bullish case with a close below 26.

In summary, this is still likely a trader's market, and not one for investors. Buying near support and selling near resistance (referencing the $SPX chart) is the best approach until the market breaks out over 1420 or below 1265.
Lawrence G. McMillan is the author of two best selling books on options, including Options as a Strategic Investment, recognized as essential resources for any serious option trader's library.
|