| Corcoran Technical Trading Patterns for February 11 |
| By Clive Corcoran |
Published
02/11/2008
|
Stocks
|
Unrated
|
|
|
|
Corcoran Technical Trading Patterns for February 11
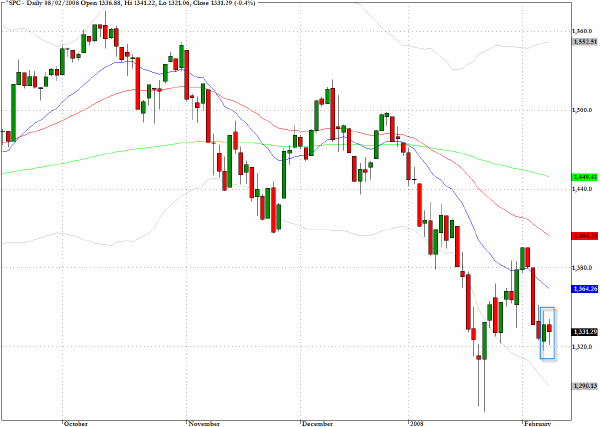
Narrow range trading prevailed in Friday's session. The S&P 500 (^SPC) concluded with an inside formation and leaves intact the hypothesis that Thursday's retesting of the January 23 low was resolved in favor of further recovery for equities.
I must confess to being slightly wary at this stage about the reliability of this most recent testing and for me the hypothesis remains unproven. As previously suggested, a decisive closing below 1260 could precipitate an avalanche of selling.
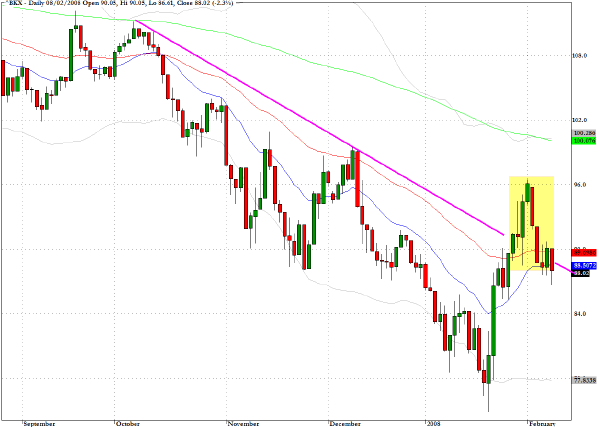
The financials have been leading the overall market to the downside and I am now paying close attention to the banking index (^BKX) to gauge where we may be in regard to any incipient recovery. The false breakout was not too surprising but now the return to the descending trendline from above will allow insight into whether more courageous fund managers may have already discounted all of the bad news for the sector.
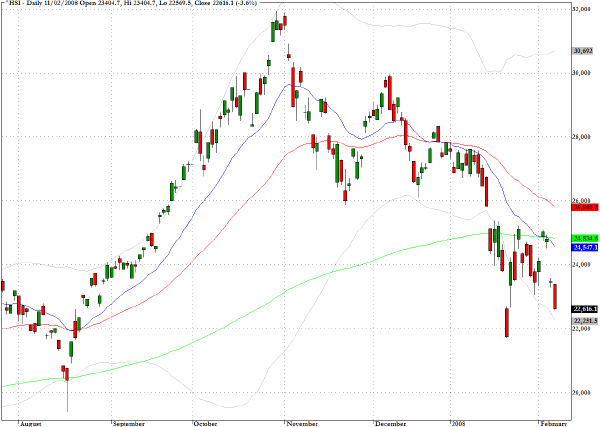
Several Asian markets were closed in Monday's trading, including Japan's Nikkei, but the Hang Seng index (^HSI) re-opened after last week's Chinese New Year celebrations. It had some catching up to do as other global markets continued downwards while it was closed at the end of last week.
The index, which is often seen as a useful barometer of the speculative sentiment amongst global asset allocators, has come close to a re-test of the January 22 intraday low and could thus be aligning itself with the hypothesis that I discussed above.
The Mumbai Exchange (^BSESN), which was not closed last week, continued its downward trajectory and lost almost five percent in Monday's session.
Both exchanges, in Mumbai and Hong Kong, have seen acute corrections in the last few weeks with the Hang Seng down almost 40% from a high just below 32000 in late October and Mumbai down by more than 25% since its early January high close to 21,000.
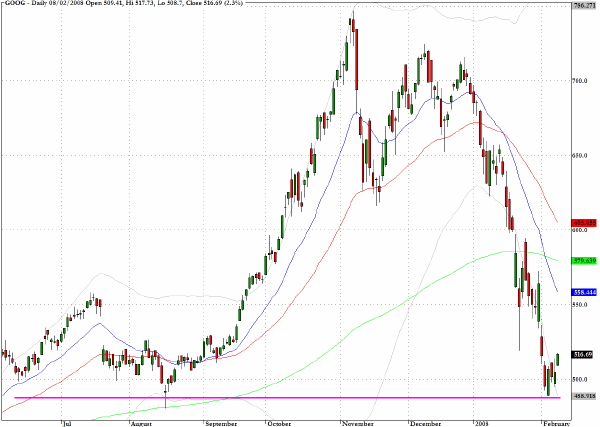
Google (GOOG) is at a critical chart level at which some support should be forthcoming.
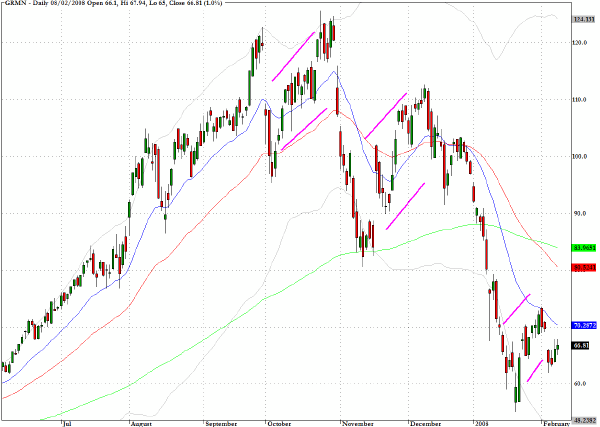
The chart pattern for Garmin (GRMN) is unusually bearish with a staircase pattern of bear flags. Another has been forming in recent sessions.
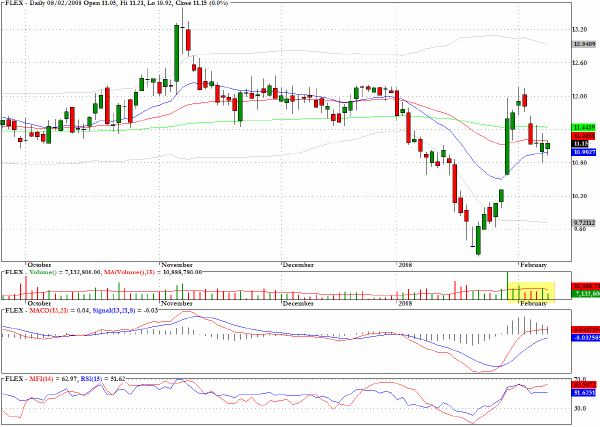
Flextronics (FLEX) has a pullback pattern that seems likely to be resolved in favor of higher prices ahead.
Clive Corcoran is the publisher of TradeWithForm.com, which provides daily analysis and commentary on the US stock market. He specializes in market neutral investing and and is currently working on a book about the benefits of trading with long/short strategies, which is scheduled for publication later this year.
Disclaimer
The purpose of this article is to offer you the chance to review the trading methodology, risk reduction strategies and portfolio construction techniques described at tradewithform.com. There is no guarantee that the trading strategies advocated will be profitable. Moreover, there is a risk that following these strategies will lead to loss of capital. Past results are no guarantee of future results. Trading stocks and CFD's can yield large rewards, but also has large potential risks. Trading with leverage can be especially risky. You should be fully aware of the risks of trading in the capital markets. You are strongly advised not to trade with capital.
|