NASDAQ COMMENTARY
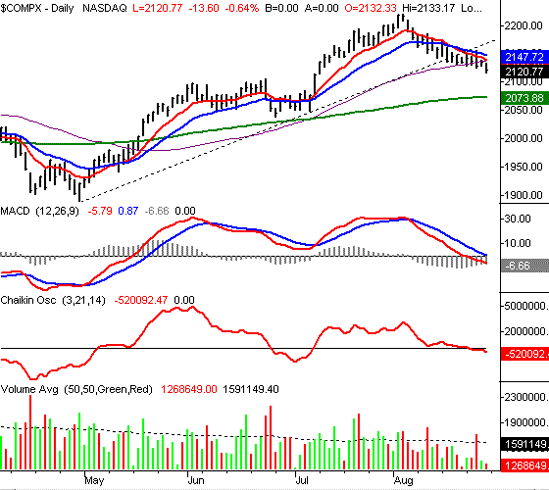
The NASDAQ's 14.8 point loss last week was a dip of only 0.7 percent. In those terms, it may seem only minor, but the week was actually full of significant technical damage. At this point, nearly all of July's gains have been given back, and the close at 2120.77 is the lowest we've been in weeks (and is also under most of the key short-term and intermediate-term lines). More than that, it looks like we're still headed lower.
Since hitting a peak of 2220 in early August, the composite has pulled back by almost 100 points. That's a correction of 4.5 percent, and is the biggest loss of any index from that August 3rd close.
But the real story here is the 50 day line (purple). Last week we mentioned that we couldn't get too bearish, as the index was still trading above that important intermediate-term line. That changed last week. Unable to get back across the 20 day line (blue), the buyers threw in the towel, allowing the NASDAQ to slip under the 50 day average. So now, we have several momentum-based sell signals. One thing to add.....the 10 day line is now under the 50 day line too. That's the first time we've seen this since May, and it does not bode well for the market.
With the current bearish momentum, we're planning on a retest of the 200 day line (green) as support. It's currently at 2073.88. That's 2.2 percent under the current level. Adding that potential loss to the 4.5 percent we've already given up since early August, and the grand total of the correction comes to about 6.7 percent. That's a little bugger than the ordinary corrective move, but then again, the NASDAQ has been the weakest of the three indexes we study.
NASDAQ CHART - DAILY

S&P 500 COMMENTARY
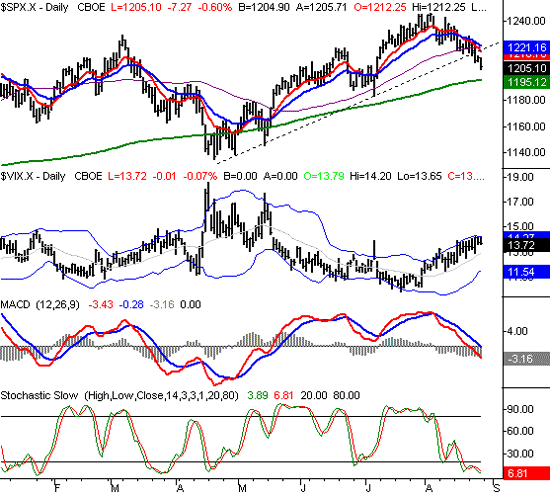
The S&P 500 lost 1.2 percent last week, falling from 1219.71 to 1205.10. That 14.6 point slide is no small matter, as it leaves the SPX at the lowest close we've seen since July 7th. If the date seems familiar, it should. That's the day of the first tragic London bombings, and it's also the day that the rally began, after the initial selloff. We flew as high as 1246.86 by the time August came, but since August 3rd, we've fallen 3.3 percent. (or 40 points).
Like the NASDAQ, the 50 day line was the make-or-break point, and the SPX failed that test too. In fact, the S&P 500 also broke under a pretty important support level (dashed). The next support level here is also the 200 day line, at 1195. That's about 0.8 percent under Friday's close, which is next to nothing. The point being, this short-term bearishness could quickly turn into longer-term bearishness, with only ten points worth of losses (which could be incurred in two days time....or less). That's not to say that it will happen, but with the current bearish momentum we see, it wouldn't be a surprise. On the other hand, notice how the fall under the 200 day line last April wasn't a setup for a bigger bearish move.
Resistance is still at the 10 and 50 day lines, near 1217. Note that the 10 day line here is also under the 50 day line, so the index is in a little more trouble than most people may realize. We haven't traded at 1217 since Wednesday. So, even though the VIX appears to be starting to roll over a bit, it may just be a short pause before the selling continues. There's a 12 point gap between where we ended on Friday and the first resistance level. That means we have room for a little buying before resistance is broken. So, don't confuse a little bullishness for a reversal. We won't be bullish again until we get back above the 20 day line.
S&P 500 CHART

Price Headley is the founder and chief analyst of BigTrends.com.