Professional trader Price Headley provides a look at the stock market for the week of February 11.
NASDAQ Composite
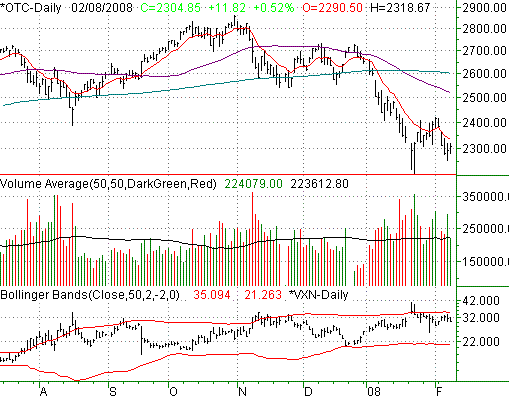
Friday's close of 2304.85 for the NASDAQ was the result of an 11.82 point (+0.52%) gain, the only winning index for the day. For the week, the composite still finished in the red by 105.51 points (-4.5%). Though oversold, the trend remains bearish.
Most of our analysis today is on the other two charts, but we did want to mention one thing: watch for a move under 2202. That's new multi-week low territory. The way the NASDAQ is hitting resistance at the 10-day line though, we may fall under that level in the coming week. We're at a major inflection point.
NASDAQ Composite Chart - Daily 
S&P 500
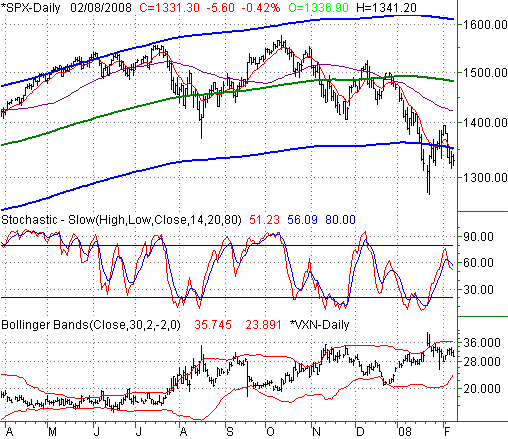
The SPX fell by 5.6 points (-0.42%) on Friday, leaving the large cap index at 1331.30. That meant a 64.1 point loss (-4.59%) for the week. As with the NASDAQ, the dead cat doesn't seem willing to bounce yet.
A couple of weeks ago, we discussed how most indices were limited in how much they could deviate from their 200-day moving average line. We found the general rule of thumb was that a reversal was probably near when any index was about 10% above or below the 200-day average. To illustrate that point, we plotted such a moving average envelope on each index chart.
We've plotted the same envelope today on the SPX's chart (the blue lines are the envelope), but for a different reason today. Though there are still basic limitations to how far removed the index can get from its 200-day line (green, on our chart), when we see those limits being tested persistently, that too can have meaning.
In this case, it's bearish. Why? Even before we could 'revert to the mean' of the 200-day line, the S&P 500 is already back under that lower envelope line. The last time we saw the index spending so much uncontested time at or under the lower envelope line was -- you guessed it -- in 2001.
In the short run, we see a little potential for an upside pop, based on the VIX. In the bigger picture, we really have to wonder if the underlying trend has changed into bear market mode.
S&P 500 Chart - Daily 
Dow Jones Industrials
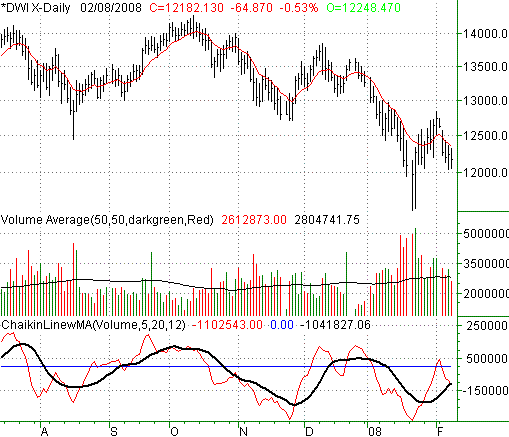
The Dow fell another 64.8 points on Friday (-0.53%). On a weekly basis, the blue chip index sank 4.4%, or 561.06 points, one of the worst weeks in a long time. The trend's momentum doesn't look any better.
Remember the work we were doing on the Dow's volume, using the Chaikin line as the specific buy/sell signal? Though we could never successfully systemize it, we still found out to be helpful in terns of spotting the undertow. So, we want to focus on that tool again today; it's on the bottom pane of the chart below.
The red line (thin) is the Chaikin line, a volume-weighted momentum line. The black line (thick) chasing it is a moving average of the line. The idea is simple enough - crosses of the Chaikin line and its moving average hint of bullish or bearish things to come (depending on which direction the cross was made). Well, as of Friday, we just saw a bearish cross under the moving average line. You can visually see the same on the raw volume bars in the middle of the chart - the green bars are getting shorter, and less frequent.
We've also noticed the Dow is finding resistance again at its 10-day moving average line (red, thin).
As it stands now, we have to side with the bearish momentum. Like last time, a breach of the 10-day line could be a short-term bull signal, but we're skeptical based on lessons lerned in the last few weeks.
Dow Jones Industrials Chart - Daily 
Price Headley is the founder and chief analyst of BigTrends.com.