| A Mid-Week Look at the Market |
| By Price Headley |
Published
02/14/2008
|
Stocks
|
Unrated
|
|
|
|
A Mid-Week Look at the Market
NASDAQ Composite
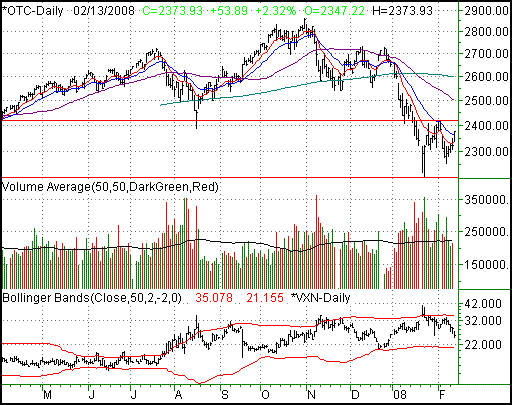
Wednesday's 53.89 point gain (+2.32%) was one of the biggest single-day rallies in a while, leaving the composite at 2373.93. For the week, it's up 3.0%, or 69.08 points. That's generally bullish, but don't get too excited; it's option expiration week, and we did the same thing a couple weeks ago only to get whacked.
In the bulls' defense, the NASDAQ closed above the 20-day moving average line (blue) for the first time all year. We have to give it a little credit for that. However, that's not nearly enough of a compelling reason t get excited. The NASDAQ's bullish volume (like the Dow's) has been fading over the life of this rally.
So where do we go from here? The bulls could argue that the VXN still has room to fall...and they'd be right. However, there's not a lot of room for the VXN to slide lower before the lower band at 21.1 is intercepted. That may be enough room to let the NASDAQ get up to the February peak of 2419. At that point, any big problems are likely to come to light at the same the VXN hits a floor. If we can break past that level, then more power to the bulls.
As for the bears, one more move back under the 10-day line at 2337 could pretty much break any remaining confidence from the buyers.
NASDAQ Composite Chart - Daily

S&P 500
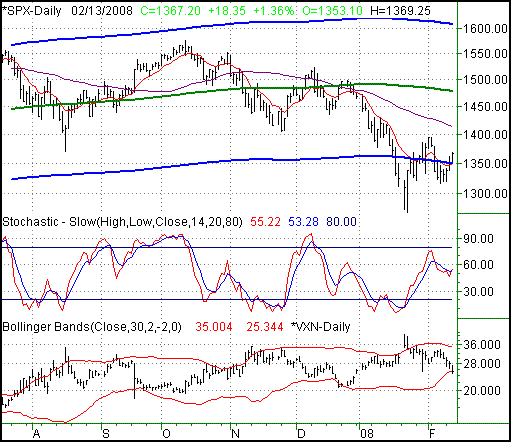
On Wednesday we saw the S&P 500 rise by 18.35 points and close out at 1367.2, a 1.36% gain. Week-to-date it's up by 2.7%, or 35.90 points. However, as enticing as that sounds for the bulls, it's going to be tough to tack on any more gains right now.
We've re-plotted the 200-day, 8% moving average envelope again. The blue lines are the envelope; the green line is the 200-day line. You may recall (or may not) we've been interested in this tool recently, as it's come into play for the first time in months.
As you'll see, the SPX is back inside the envelope - no surprises there. The question is, can it stay there? And if so, how long?
This may be one of the trickiest scenarios we've seen in a while. Longer-term we're bearish; the downward-sloped 200-day line is a problem we haven't seen for years. In the short run we seem poised for a bullish counter-trend...or do we? Based on the current momentum we'd have to assume bullishness.
The problem is the VIX - it's already back at the lower Bollinger band. Yes, there's the possibility it could keep pressing the lower band even lower, but it hasn't been keen in doing that (at all) in the last several weeks. So, the odds favor a bounce for the VIX and a dip for the S&P 500.
The asterisk here is that we're in the midst of expiration week, meaning options-based tools like the VIX may be skewed. But still, we've not even seen recent expiration weeks shake the VIX's up-and-down pattern.
Once the VIX gets off of the lower band, then we're back to the coin-toss. The 20-day (not shown) and 50-day (purple) moving averages remain the key to that puzzle.
S&P 500 Chart - Daily

Dow Jones Industrial Average
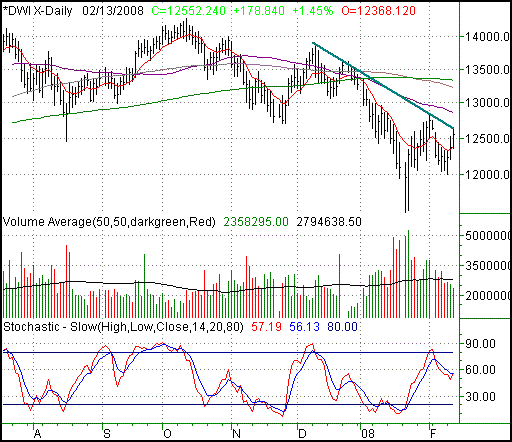
The Dow pushed higher by 178.8 points (+1.45%) on Wednesday, making its way to 12,552.24. That's 370.1 points, or +3.04%, above Friday's close.
Yes, the Dow got above its 10-day line as well, but a problem for the bulls became quietly evident today; the buying volume is fading (the green volume bars are getting shorter and shorter). That's not good.
You'll also see the Dow bumped into a short-term resistance line on Wednesday. Even if that ceiling can be broken tomorrow, the 50-day line looms at 12,857. So, the weight of the recent gains is already mounting.
Dow Jones Industrial Average Chart - Daily

Expiration is Friday, so anything we say today has something of a built-in footnote. Be sure to check out this weekend's outlook for 'the rest of the story'.
Price Headley is the founder and chief analyst of BigTrends.com.
|