| The McMillan Options Strategist Weekly |
| By Lawrence G. McMillan |
Published
02/15/2008
|
Options
|
Unrated
|
|
|
|
The McMillan Options Strategist Weekly
Our various indicators have done a good job of steering us through the markets so far this year. Our speculative broad market recommendations, both in The Option Strategist and in The Daily Strategist (as well as Daily Volume Alerts) have been strong -- the strongest start to any year in our 17-year history. So, we are not going to deviate from them in our current market analysis.
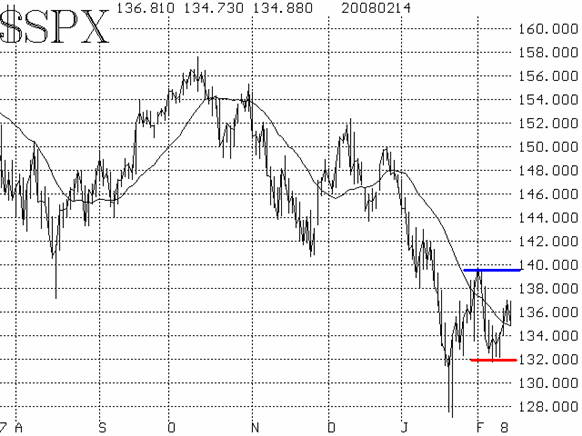
The chart of the S&P 500 Index ($SPX) itself is one of the most negative indicators at the current time. Twice it has tried to poke above its declining 20-day moving average. The first attempt came at the beginning of February and failed, leaving resistance at 1390-1400 in its wake. $SPX did manage to close above that moving average for a couple of days, but the average itself never turned upward, so it retained its overall bearish look and eventually pulled $SPX backdown. This week, another such attempt has been made, as $SPX has once again rallied off of a good support area (1315-1325) and closed above its 20-day moving average yesterday. However, that moving average is still declining and is thus still bearish; witness the struggle that $SPX experienced today (as an aside, is Bernanke the biggest market jinx since Arthur Burns or what?!? Burns was Fed Chairman during the Nixon administration and accelerated the 1973-1974 bear market every time he opened his mouth). So, except for the fact that $SPX showed good support at 1315-1325, there isn't much positive about its chart. Looking at the $SPX chart, one could make a case for a trading range between roughly 1320 and 1400. A breakout in either direction would be a significant development.

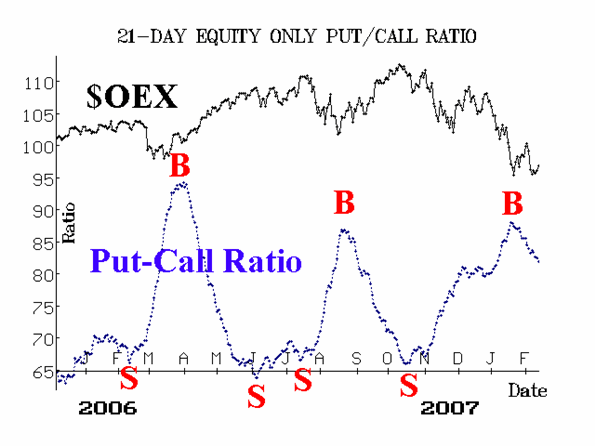
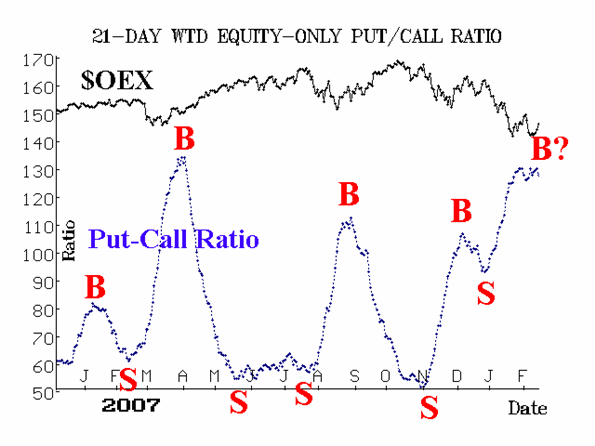
The equity-only put-call ratios are bullish. The standard ratio (Figure 2) is clearly on a buy signal. The weighted ratio, (Figure 3) however, is much shakier (chart, above center). The computer analysis program keeps saying that the weighted ratio is on a buy signal, but you can see that if it makes new highs, that would be bearish and would throw it back onto a sell signal -- requiring a whole new setup for a buy signal.

Market breadth has been a surprisingly good indicator in the last couple of months, but it hasn't issued a new signal recently.

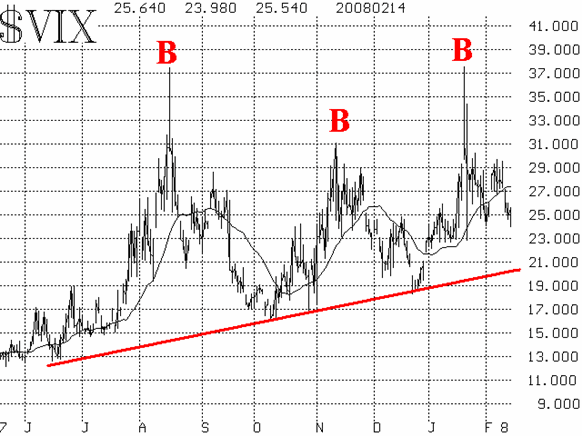
Volatility indices ($VIX and $VXO) can be considered bullish. $VIX was moving bearishly higher when the broad market was testing the $SPX 1320 support level, but once that test was successfully passed, $VIX has dropped below 26, confirming a short-term bullish trend. Also, the intermediate-term spike peak buy signal of late January is still in place.

In summary, the indicators are mixed, but are generally leaning more to the bullish side than the bearish. On the bullish side, we have the equity-only ratios, $VIX, and the "breadth differential" indicator.The only actual bearish "indicator" is the chart of $SPX itself -- a significant indicator to be sure. Hence we expect to see the top of the $SPX range (1390-1400) challenged before the bottom is.
Lawrence G. McMillan is the author of two best selling books on options, including Options as a Strategic Investment, recognized as essential resources for any serious option trader's library.
|